FMP
Forecast Bridges: Linking Economic Surprises with Company-Level Fundamentals Using FMP APIs
Dec 16, 2025
When macro data shocks the market, prices can reset in seconds. On May 12, 2021, the U.S. core CPI print came in 0.6 percentage points above consensus, and Nasdaq 100 futures dropped by roughly 150 points almost immediately. For traders, that's a dramatic chart; for FP&A teams, corporate strategists, and macro analysts, it's a harder question: how does that macro shock filter through sectors and ultimately into company KPIs?
This article walks through how to build a practical “forecast bridge” using Financial Modeling Prep (FMP) APIs. You'll see how to
- detect an economic surprise in real time
- measure how sectors rotate in response
- trace those shifts into changes in company fundamentals.
The goal is a repeatable, data-driven workflow that connects macro events to your sector outlooks and company-level performance metrics
Economic Surprises: Why Macro Shocks Matter
In practice, an economic “surprise” is just the gap between the consensus forecast and the number that actually prints. That forecast error—positive or negative—is what drives rapid repricing: upside growth data tends to support cyclicals, while upside inflation surprises often pressure rate-sensitive assets and lift parts of value and financials.
Rather than dwell on definitions, the key is wiring surprise detection into your workflow:
- Use the Economic Data Releases Calendar API as your expectations feed.
Pull the schedule of upcoming releases (e.g., CPI, payrolls, GDP) along with consensus estimates and prior values. - At release time, call the Economic Indicators API for the actual print.
Retrieve the latest value plus a relevant history window so you can see where today's number sits in context (e.g., relative to the last few years of data). - Compute and store a standardized surprise metric.
For example, calculate actual - consensus or a z-score based on the historical distribution of that indicator. Tag it with direction (positive/negative), magnitude, and indicator type.
A stronger-than-expected jobs report might register as a large positive surprise in your system; an inflation overshoot as a sizable negative surprise for risk assets. Either way, the combination of the Economic Data Releases Calendar API and the Economic Indicators API gives you a real-time mechanism to detect macro shocks and size their importance—the first step in the macro-to-micro bridge you'll use downstream.
From Macro to Sector: Gauging Impact with Sector Performance Data
Once you've flagged a data release as a meaningful surprise, the next question is simple: which sectors are actually absorbing the move? Growth-friendly surprises often support cyclicals like industrials and consumer discretionary, while rate or inflation shocks can benefit financials and pressure long-duration sectors such as technology.
FMP's Historical Market Sector Performance API lets you measure this systematically instead of relying on intuition:
- Pull sector returns for the surprise date.
Query sector-level percentage changes for the release day (and optionally a short window around it) across the major sectors. - Rank sectors by performance to map winners and losers.
Identify which sectors rallied and which sold off in response to the surprise. This turns a single macro print into a concrete sector rotation profile. - Build a library of “sector fingerprints.”
Store each event with its surprise metadata (indicator, direction, size) and the associated sector return pattern. Over time, you'll see recurring relationships—for example, how big upside payroll surprises typically redistribute performance across cyclicals, defensives, and rate-sensitive sectors.
This sector layer becomes the middle span of your forecast bridge. It transforms an abstract macro surprise into a focused set of industries where you should expect changes in demand, margin pressure or relief, cost structure, and capital allocation—setting you up to trace the impact further down to company-level fundamentals.
Historical Market Sector Performance API response example: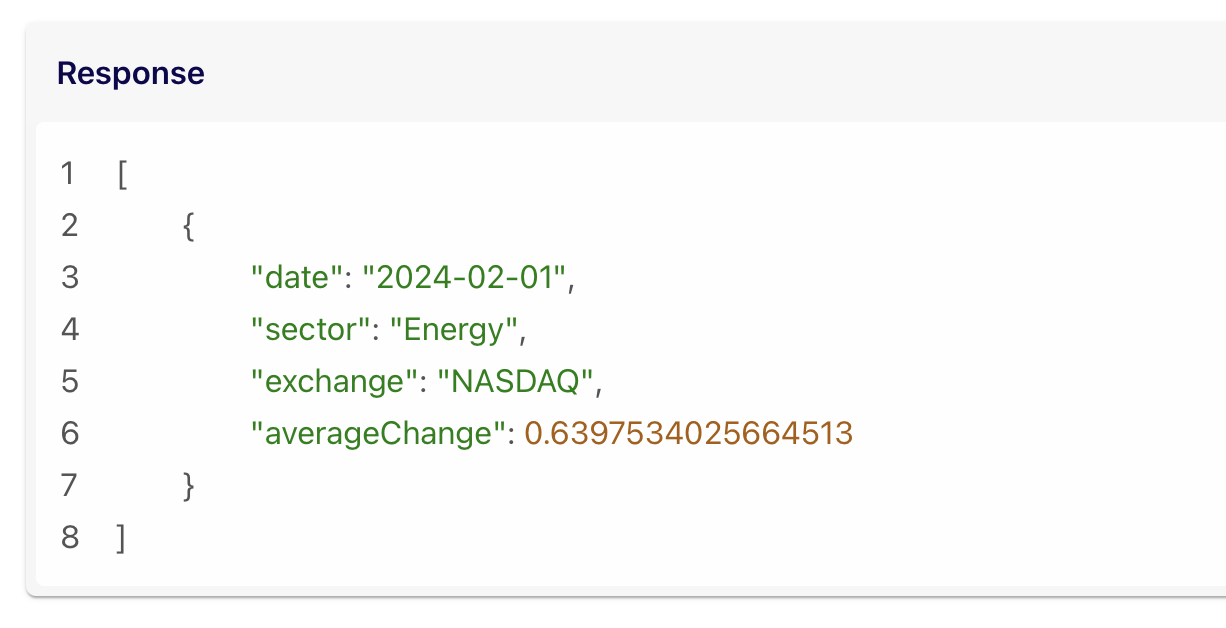
You can pull daily percentage changes by sector to see exactly how each sector moved on a given date - ideal for post-mortems of surprise events.
For instance, after that big payrolls surprise, you could query sector performance for the release date to find which sectors spiked or slumped. If financials were up +2% and consumer discretionary +1%, while tech fell -1%, it paints a clear picture of market interpretation.
Over longer horizons, the same API lets you detect sector-specific trends and even perform cross-sector comparisons. This is invaluable for identifying which macro forces (e.g. inflation, rates, consumer spending) drive sustained sector outperformance or underperformance.
Sector KPI insight
Macro events also affect sector-level fundamentals. An oil price shock can lift revenue and margin expectations for exploration and production companies, while increasing fuel costs for airlines and transportation firms. These shifts represent the KPI layer of the bridge—where macro forces begin to shape the financial metrics that FP&A teams monitor.
The Sector Performance API shows which industries are gaining or losing momentum at a glance. By connecting macro indicators to sector KPIs, you form a crucial middle layer of the forecast bridge - translating economy-wide changes into industry-level effects.
Company Fundamentals: Tracing Macro Ripples to the Bottom Line
Macro and sector moves ultimately show up in company financials. With FMP's Key Metrics API, you can track top-level KPIs—revenue growth, net income, margins, valuation ratios—and line them up against your macro-surprise and sector-rotation history to see whether fundamentals moved as expected.
To explain those shifts, the Income Statements API lets you drill into the drivers: net interest income and interest expense for banks after a rate surprise, revenue and COGS for retailers after a demand surprise, or fuel and operating costs for transportation names during an energy shock.
Together, these two APIs give FP&A and strategy teams a concise way to test “macro → sector → company” hypotheses. You're not proving causality, but you are checking whether the KPIs that feed planning, budgeting, and scenarios actually responded in line with the macro story.
Using FMP, you could automate a workflow that:
- Flags a macro surprise via the Economic Calendar API.
- Immediately pulls sector performance data for the relevant date to see market reaction by industry.
- Retrieves key metrics for companies in the most affected sector to gauge fundamental impact.
This gives a multi-dimensional view of the event.
For instance, a surprise jump in retail sales might show as a broad Consumer Discretionary sector gain of +3% that day, and when quarterly results arrive, Key Metrics show several retail companies with double-digit revenue growth.
The macro print, sector KPI, and company fundamentals all align to tell one story. By quantifying these links, FP&A leaders can better answer strategic questions like
|
How will a recession risk (GDP surprise down) affect our sector and our company's KPIs? |
Linking Economic Surprises with Company-Level Fundamentals
In the end, the bridge is straightforward: macro surprises hit markets, markets reshuffle across sectors, and those sector moves flow through into company financials. FMP's APIs let you put numbers on each step:
- Economic Calendar API: surface upcoming releases and the consensus baseline.
- Economic Indicators API: capture the actual print and gauge how unusual it is versus history.
- Historical Market Sector Performance API: quantify which sectors rallied or sold off around the event.
- Key Metrics + Income Statements APIs: check whether company KPIs and line items (revenue, margins, interest costs, etc.) evolved in a way that matches the macro and sector story.
Used together, these endpoints support a consistent, data-driven workflow that links macro events to sector behavior and, ultimately, to the company metrics that drive forecasting, scenarios, and board-level discussions.
FAQs
What exactly is an “economic surprise”?
An economic surprise refers to an economic indicator release that significantly deviates from market expectations or consensus forecasts. For example, if analysts forecast 5% annual GDP growth and the actual release is 3%, that negative gap is a surprise. Markets often react strongly to such surprises - positive surprises (better-than-expected data) can boost investor confidence and risk appetite, while negative surprises can prompt sell-offs or flight to safety. In short, it's the difference between what was expected and what actually happened, and it's a key driver of short-term market volatility.
Why should FP&A teams and strategists care about macroeconomic surprises?
Because macro surprises can cascade into your company's performance. Even if your day-to-day focus is on company financials, big swings in interest rates, inflation, employment, etc., create the backdrop in which your business operates. These surprises can alter consumer demand, input costs, financing rates, and more. Incorporating macro data into planning gives FP&A teams a heads-up to adjust forecasts or budgets. By monitoring economic surprises, you add an early-warning system for risks and opportunities that purely internal data might miss.
Which FMP API should I use to track upcoming economic data releases and forecasts?
Use the FMP Economic Data Releases Calendar API. This API provides a schedule of upcoming economic releases along with their dates and details. It's essentially a real-time economic calendar accessible via API. You can retrieve data like the release name (e.g. “Nonfarm Payrolls”), release date and time, the consensus forecast, and previous values. By querying this API regularly, you'll stay informed about impending releases and be prepared to capture the actual results when they come out. It's an essential tool to anticipate market-moving events and plan your analysis around them (for example, knowing that a Fed rate decision or jobs report is coming up).
How do macroeconomic indicators influence sector performance?
Macroeconomic indicators often have sector-specific impacts. The effect depends on the nature of the indicator and the sector's sensitivities. For instance, a strong GDP growth reading (or any indicator signaling economic expansion) tends to favor cyclical sectors - think industrials, consumer discretionary, materials - as these sectors thrive on economic growth. A surprise jump in consumer spending could send retail and travel stocks higher.
In contrast, rising inflation (CPI) usually hurts sectors sensitive to interest rates (like tech or utilities) but can benefit commodities or real assets - investors might rotate into energy stocks, gold miners, or real estate as inflation hedges.
Meanwhile, a weakening labor market (rising unemployment) could prompt shifts into defensive sectors such as healthcare or consumer staples, which are more resilient during downturns. In summary, macro indicators guide investors on which sectors to overweight or underweight, a dynamic often described as sector rotation.
How can I link sector trends to company-level fundamentals?
Start by identifying the sector trend - for example, through the Historical Market Sector Performance API you see that the banking sector has outperformed in the past month. Then connect it to company data: use FMP's Key Metrics API to pull fundamentals of chosen company. If the sector's strength was driven by macro factors (say, rising interest rates), you might expect to see that reflected in the company's fundamentals - e.g., higher net interest income (for banks), expanding profit margins, or improved return on equity (for banks).
By comparing sector KPIs and company KPIs, you can validate whether broad trends are impacting individual firms. Often, sector outperformance will align with aggregated improvements in fundamentals: for instance, an energy sector boom usually coincides with oil producers reporting higher revenues and earnings.
Do I need a premium plan to use these FMP APIs for macro and fundamentals analysis?
FMP offers a range of plans. You do not necessarily need premium to get started - the free plan provides access to core endpoints and a limited history, which might be sufficient for experimenting and handling smaller data requests. For example, you can fetch recent economic releases or a handful of key metrics on the free tier. However, if you require deeper historical data (up to 30 years), higher frequency updates, or need to make a large number of API calls (e.g., continuously pulling data for an automated model or covering many tickers and indicators), a premium plan is recommended
Premium tiers unlock more data (extended history, global coverage) and higher call rates, which is invaluable if you're building a robust, real-time macro surveillance or forecasting system. Many users start on free or starter plans to build their solution, then upgrade to Premium as they scale up usage and require more depth or speed.

Top 5 Defense Stocks to Watch during a Geopolitical Tension
In times of rising geopolitical tension or outright conflict, defense stocks often outperform the broader market as gove...

Circle-Coinbase Partnership in Focus as USDC Drives Revenue Surge
As Circle Internet (NYSE:CRCL) gains attention following its recent public listing, investors are increasingly scrutiniz...

LVMH Moët Hennessy Louis Vuitton (OTC:LVMUY) Financial Performance Analysis
LVMH Moët Hennessy Louis Vuitton (OTC:LVMUY) is a global leader in luxury goods, offering high-quality products across f...

