FMP
Integrating Macro Indicators into Your Next Research Memo: A Strategic Guide
Aug 6, 2025 7:04 AM - Parth Sanghvi


Image credit: Internet
Most research memos focus on company fundamentals—but without macro context, key signals get lost. This guide shows you how to integrate GDP, CPI, and the unemployment rate into a sharper, more strategic memo. You'll learn how to combine these indicators into a cohesive narrative using Financial Modeling Prep (FMP) APIs to ground your analysis in reliable, real-time data.
Tailoring Macro Analysis to Your Role
You already understand the value of macro indicators—but how you frame them in a research memo depends on your audience and function. Here's what to emphasize, depending on your role:
- CIOs want synthesis and signals: Highlight how GDP and unemployment trends support (or challenge) current asset allocations. Summarize systemic risks or inflection points in the macro cycle.
- Heads of Strategy need competitive context: Use macro data to anticipate shifts in consumer behavior, cost structures, or global demand that could impact long-term positioning.
- Quant Leaders look for inputs and anomalies: Emphasize historical trends, inflection points, and outliers in the data that can inform modeling assumptions or stress tests.
- Senior Analysts value framing: Show how macro conditions contextualize company or sector performance—linking fundamentals to the broader cycle adds defensibility and depth.
FMP's Economic APIs help you move from data points to perspective—offering reliable access to the trends that shape investment narratives.
The Foundation: Sourcing Authoritative Macro Data with FMP Economic APIs
Macro indicators are most powerful when analyzed together—they reveal patterns, relationships, and turning points that no single data point can show in isolation. To support that level of insight, two FMP APIs provide the essential foundation:
- FMP Economic Indicator API gives you direct access to historical macroeconomic data, including GDP, RealGDP (inflation-adjusted), CPI, and the unemployment rate. With these inputs, analysts can track long-term trends in economic output, inflation, and labor market conditions with precision.
- FMP Economic Calendar API lists upcoming macroeconomic releases, helping you anticipate key data points and incorporate the most current figures into your memo. This ensures your analysis stays both forward-looking and timely.
When querying the APIs, use the correct country symbol (e.g., "US") and adjust the limit or date parameters to control the timeframe and depth of your data pull. Together, these APIs enable analysts to go beyond data collection—and toward real macroeconomic interpretation.
Macro Indicator 1: Gross Domestic Product (GDP) - The Pulse of Growth
GDP measures the total value of all goods and services produced within a country over a given period. It's the broadest indicator of economic activity—and a foundational input for any macro-driven investment thesis.
Why It Belongs in Your Memo:
- Strategic Signal: GDP trends reflect economic expansion or contraction, shaping everything from corporate earnings and consumer behavior to credit cycles and investor sentiment.
- CIO Focus: Top-down allocators rely on GDP to gauge market momentum, identify macro risks, and fine-tune exposure across sectors and regions.
- Contextual Framing: A slowdown in GDP may signal recession risk and justify a defensive tilt. Strong growth often supports a risk-on stance in equities and cyclicals.
How to Present It:
Highlight the trajectory—growth or contraction—over the last several quarters or years. Emphasize turning points that align with shifts in market sentiment or earnings revisions. A line chart showing GDP or RealGDP over 5-10 years, annotated with recession periods, offers valuable visual context.
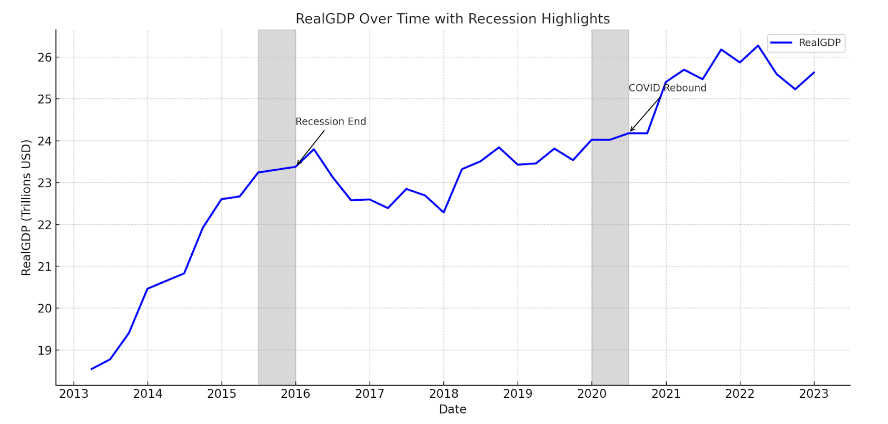
The mock table does not reflect real data and is solely for illustrative purposes. This type of chart adds narrative depth to your memo, helping stakeholders connect macro inflection points with broader market or earnings shifts.
Data Source:
Use the FMP Economic Indicator API to pull GDP or RealGDP (inflation-adjusted) data by country. This allows you to ground your analysis in reliable, up-to-date macro figures.
Macro Indicator 2: Consumer Price Index (CPI) - Tracking Inflation Pressure
CPI measures the average price changes of a standard basket of consumer goods and services over time. It's the most widely recognized gauge of inflation—and a key driver of monetary policy and market valuation shifts.
Why It Belongs in Your Memo:
- Strategic Signal: CPI affects everything from consumer spending and business input costs to bond yields and equity valuations. Sustained inflation erodes real returns and prompts central banks to act.
- CFO Focus: Crucial for pricing strategy, input cost forecasting, and profit margin planning. High or volatile CPI may require financial scenario adjustments.
- Contextual Framing: Rising CPI often signals interest rate hikes ahead—raising borrowing costs and reshaping risk appetite across sectors.
How to Present It
Show recent CPI trends and clarify the pace: is inflation accelerating, decelerating, or holding steady? Break down what's driving the movement (e.g., energy, housing, food) and connect it to sector impacts. For example, rising fuel costs may weigh on transport margins, while food inflation pressures staples.
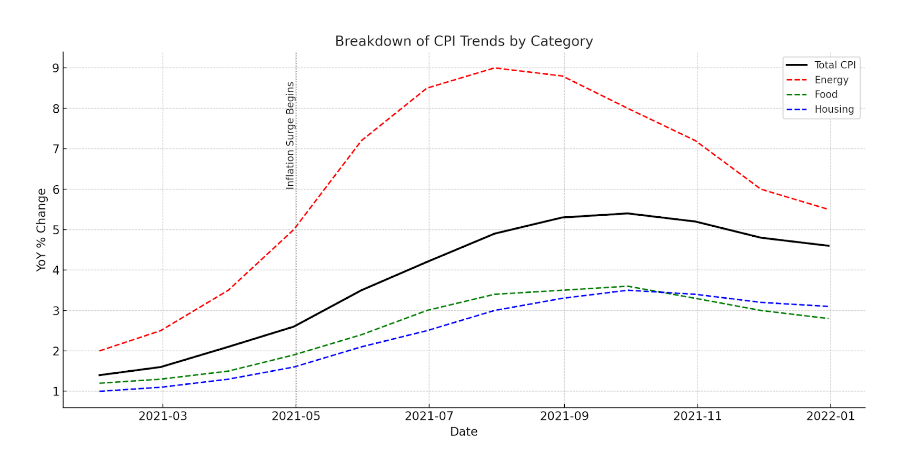
Here's a mock chart - for illustrative purposes - showing CPI trends broken down by category (Energy, Food, Housing) alongside total CPI over a 12-month period. It includes a key inflection point where inflation accelerates—a valuable visual reference for contextual analysis.
Data Source
Use the FMP Economic Indicator API to retrieve CPI or InflationRate data by country. Combine monthly trends with historical context to support a forward-looking inflation narrative.
Macro Indicator 3: Unemployment Rate - Labor Market in Focus
The unemployment rate tracks the share of the labor force actively seeking work. It's a direct measure of labor market strength—and a critical input for understanding consumer behavior, wage dynamics, and economic resilience.
Why It Belongs in Your Memo:
- Strategic Signal: Labor market trends influence consumer confidence, disposable income, and overall demand. A tight labor market (low unemployment) can lead to wage inflation, while rising unemployment often signals broader economic stress.
- Strategy Focus: Heads of Strategy use unemployment data to anticipate shifts in labor costs, spending behavior, and growth capacity—critical for long-term planning and scenario analysis.
- Contextual Framing: A rising rate may point to weakening demand and trigger fiscal or monetary responses. Sectors dependent on discretionary spending are particularly sensitive to labor market shifts.
How to Present It:
Show the unemployment rate's recent trajectory and compare it to long-term averages or full employment benchmarks. Highlight inflection points—such as upticks following a GDP slowdown—and explain implications for wage growth, policy expectations, or sector exposure.
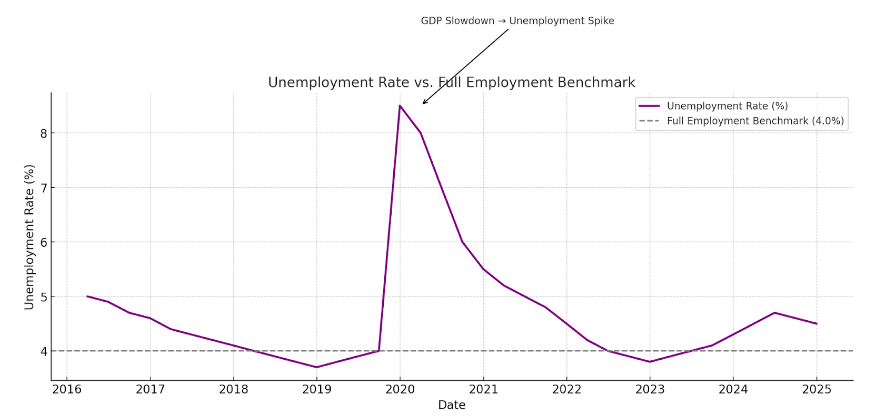
This mock chart shows an example of the unemployment rate over time, with a full employment benchmark (4.0%) and a clear inflection point following a GDP slowdown.
Data Source:
Use the FMP Economic Indicator API to access unemployment data by country. A time-series chart with recession overlays adds valuable historical context to current labor trends.
Combining Macro Indicators into a Cohesive Memo Narrative
Individual data points are informative—but real insight comes from connecting them. A well-structured memo weaves GDP, CPI, and unemployment into a clear narrative that shows how economic forces interact and what they mean for markets.
How to Structure the Memo:
- Executive Summary
Open with a crisp synthesis of the current macro outlook. Highlight key signals from GDP, CPI, and unemployment to frame the deeper analysis. - Indicator Deep Dives
Dedicate a section to each macro indicator. Present recent trends, historical comparisons, and implications for the broader economy. - Interconnections and Feedback Loops
Go beyond siloed analysis. For example: low unemployment can push wages higher, fueling inflation (CPI), which may prompt monetary tightening—each step feeding into the next. Map out these cause-and-effect chains clearly. - Investment Implications
Translate your macro view into actionable insights. Recommend specific sectors, asset classes, or positioning themes (e.g., cyclicals vs. defensives, fixed income vs. equities) based on the combined signal.
Best Practices for Communicating Macro Trends in Writing
A well-structured narrative can convey macro insights powerfully—even before charts come into play. Use these techniques to sharpen your analysis and guide stakeholders through complex economic signals:
- Lead with trends: Use clear, directional language to highlight movement over time.
Example: “GDP has grown steadily for three quarters, indicating sustained expansion.” - Draw connections: Compare indicators to surface relationships and tensions.
Example: “While CPI is decelerating, unemployment remains low—raising the risk of wage-driven inflation.” - Summarize key figures cleanly: Use bullet points to present core data points and their implications without overwhelming the narrative.
- Maintain logical flow: Organize your memo so each section builds on the last—moving from individual indicators to interconnections, and ultimately to investment implications.
Strong writing paired with strategic structure ensures your analysis is accessible, defensible, and actionable—whether or not charts are included.
Powering the Memo with FMP APIs
FMP's Economic Indicator and Economic Calendar APIs provide the real-time, structured data needed to support your analysis. You can pull this data directly into Excel or plug it into your analytics stack for automated, up-to-date insights—no scraping or manual entry required.
Driving Smarter Investment Decisions with Macro Context
Integrating macro indicators like GDP, CPI, and unemployment is essential for producing research that goes beyond the surface. When combined into a cohesive narrative, these data points reveal the underlying forces driving markets—supporting sharper, more strategic investment decisions.
FMP's Economic Indicator and Economic Calendar APIs offer the reliable, structured data needed to anchor this analysis. For deeper insights, consider layering in additional macro variables—such as interest rates, consumer sentiment, or manufacturing indices—and incorporating forward-looking forecasts or scenario analysis to enhance predictive power.
For examples of how to apply comprehensive macroeconomic data at scale, see research from the United Nations Conference on Trade and Development (UNCTAD), which offers global context and methodology: Macroeconomics | UN Trade and Development (UNCTAD).
Ready to level up your investment research? Explore Financial Modeling Prep's API documentation to start embedding macro intelligence directly into your analytical workflow.
FAQs: Common Questions on Macro Indicators in Research
What are the most important macro indicators for investment analysis?
For broad investment analysis, the most crucial macro indicators typically include Gross Domestic Product (GDP), which provides a comprehensive measure of economic growth; the Consumer Price Index (CPI), essential for gauging inflation; and the Unemployment Rate, which reflects the overall health and slack in the labor market. These three indicators, when analyzed together, offer a robust view of economic conditions and are foundational for strategic decision-making.
How can I use the FMP Economic Indicator API to track GDP and CPI for my research?
You can access historical GDP and CPI data directly from the FMP Economic Indicator API by making programmatic requests to its economic indicators endpoint. Specify the country (e.g., "US") and request specific fields like GDP or RealGDP for economic output, and CPI or InflationRate for price level and inflation trends. The API provides structured data, making it straightforward to integrate into spreadsheets or analytical applications for detailed historical analysis.
Why is the unemployment rate considered a key economic indicator for investors and analysts?
The unemployment rate is vital because it offers direct insights into consumer confidence, disposable income levels, and the overall strength of the economy. A consistently low unemployment rate often signals a tight labor market, which can lead to wage inflation and increased consumer spending, boosting corporate revenues. Conversely, a rising rate suggests weakening economic conditions, reduced consumer demand, and potential shifts in government fiscal policy, impacting sectors reliant on discretionary spending.
How do analysts effectively combine different macro indicators to create a cohesive research memo?
Analysts create a cohesive research memo by first analyzing each indicator's individual trends and historical context. The critical step is then to identify and articulate the interconnections and causal links between them. For example, explaining how sustained low unemployment might lead to wage growth, which in turn could fuel inflationary pressures (CPI), or how a slowdown in GDP can precede a rise in unemployment. This integrated narrative translates raw data into actionable investment implications for specific sectors or asset classes.
What is the role of the FMP Economic Calendar API in ensuring timely and relevant economic analysis?
The FMP Economic Calendar API plays a crucial role by providing a calendar of upcoming economic data releases. This allows analysts to anticipate market-moving events and prepare for their potential impact on financial markets. By staying informed about the timing of these releases, analysts can ensure their research memos incorporate the freshest data, enabling more proactive and relevant economic analysis.
How do macroeconomic indicators influence sector-specific and asset allocation investment decisions?
Macroeconomic indicators directly influence these decisions by signaling broad economic shifts and potential performance drivers. For example, strong GDP growth typically favors cyclical sectors (e.g., industrials, consumer discretionary) and equities overall. Rising inflation (CPI) might lead investors to prefer inflation-hedging assets like commodities or real estate. Conversely, a weakening labor market (rising unemployment) could prompt a shift towards defensive sectors or fixed income, aligning portfolio strategy with the prevailing economic winds.
Are there limitations to relying solely on historical macro data for investment forecasting and future outlooks?
Yes, relying solely on historical macro data has limitations because it is backward-looking. While essential for understanding past trends and cycles, it doesn't inherently predict future events. For accurate forecasting, analysts must integrate historical data with forward-looking elements such as economic forecasts, market sentiment, geopolitical factors, and scenario analysis. Combining historical insights with real-time data from sources like the FMP Economic Calendar API provides a more comprehensive and predictive outlook.
Other Blogs
Dec 22, 2024 7:59 AM - Sanzhi Kobzhan
Two great Software Platform Stocks Similar to Palantir (PLTR)
When it comes to cutting-edge software and data analytics, Palantir Technologies (NYSE: PLTR) is often front and center. But for many investors, it’s important to consider alternative or complementary stocks in the same sector that may offer robust growth potential. As PLTR looks expensive (overvalu...

Dec 30, 2024 4:32 AM - Sanzhi Kobzhan
Walk Me Through a DCF: A Simple Guide to Discounted Cash Flow Valuation
Are you curious about how professional investors decide whether a stock might be one of the best undervalued stocks to buy now? One of the most popular tools is the Discounted Cash Flow (DCF) model. In this article, I’ll walk you through a DCF step by step. By the end, you’ll see how the Advanced DC...

Jan 8, 2025 7:56 AM - Sanzhi Kobzhan
Understanding EPS and How It Helps Investors Find Great Opportunities
Investors often look at a variety of metrics to figure out how well a company is doing. One such important metric is Earnings Per Share (EPS). If you’ve ever wanted to know the eps meaning, here’s a straightforward explanation: EPS shows how much profit a business earns for each of its outstanding s...
