FMP
Debt to Total Assets Ratio: What It Tells You About Financial Stability
Sep 14, 2025
In recent years, the balance sheets of many high-growth companies have undergone a dramatic transformation.
For instance, Tesla's debt-to-total-assets ratio decreased significantly from 2020 to 2023, signaling a profound deleveraging shift in its capital structure and financial health. This trend reflects a broader move by companies to strengthen their financial stability in an environment of rising interest rates and economic uncertainty.
For equity analysts, research associates, and risk managers, the debt to total assets ratio is a cornerstone metric for assessing a company's financial leverage and long-term solvency. This ratio provides a quick yet powerful view into how a company's assets are financed, whether by debt or by equity.
In this guide, we will go beyond a simple definition to explore what the ratio truly signals, bust common myths, and demonstrate how modern data APIs enable scalable, in-depth analysis.
What is the Debt to Total Assets Ratio?
The debt to total assets ratio (D/A) is a key leverage ratio that indicates the proportion of a company's assets financed through debt. In essence, it answers the question: "For every dollar of a company's assets, how many cents are funded by borrowed money?" A ratio of 0.50, for example, means that half of the company's assets are financed by debt, while the other half is funded by equity.
Formula
The calculation is straightforward:
Debt to Total Assets = Total Liabilities ÷ Total Assets
This ratio is an essential part of an analyst's toolkit because it directly reveals the extent of a company's financial risk.
Key Insights
- A higher ratio indicates greater financial leverage and potential risk. A company with a high D/A may struggle to borrow more money, especially during an economic downturn, and is more vulnerable to rising interest rates.
- A lower ratio suggests a conservative capital structure. Such companies have a greater proportion of their assets funded by equity, making them more resilient to market shocks and better positioned to secure new financing.
- Industry benchmarks are critical. A D/A ratio that is considered high for a tech company may be considered normal for a bank or a utility company, which are naturally asset-intensive and leverage-heavy.
How to Calculate Debt to Total Assets from the Balance Sheet
Calculating the debt to total assets ratio requires two key data points: a company's total liabilities and its total assets. Both figures are found on the company's balance sheet.
Using Balance Sheet Data
Manually pulling these figures from annual reports (10-Ks) can be a tedious and error-prone process. Financial statements often use different line-item names, and the sheer volume of data makes cross-company comparisons a challenge.
The FMP Balance Sheet Statement API provides normalized assets and liabilities data, helping analysts calculate leverage ratios without worrying about mismatches across filings. This automation is crucial for building scalable financial models and performing peer analysis.
Example - Tesla
Using data from the FMP Balance Sheet Statement API, let's calculate Tesla's D/A ratio over several years to illustrate its deleveraging story.
- 2024: Total Liabilities: $48.39B / Total Assets: $122.07B = 0.40x
- 2023: Total Liabilities: $43.01B / Total Assets: $106.62B = 0.40x
- 2022: Total Liabilities: $36.44B / Total Assets: $82.34B = 0.44x
- 2021: Total Liabilities: $30.55B / Total Assets: $62.13B = 0.49x
- 2020: Total Liabilities: $28.47B / Total Assets: $52.15B = 0.55x
The trend is clear: Tesla's reliance on debt to finance its assets has been steadily decreasing from 2020 to 2024, even as its total assets have grown dramatically. This shift signifies a stronger, more resilient capital structure, which is a major positive for the company's financial stability.
Interpreting the Debt to Total Assets Ratio
The D/A ratio is most insightful when viewed within a broader context. A raw number means little without industry benchmarks and an understanding of its implications.
Thresholds Analysts Use
While there are no universally accepted "good" or "bad" numbers, analysts often use these general rules of thumb:
- A ratio of 0.5 or greater often signals high leverage, though this can vary significantly by sector.
- A ratio less than 0.3 is generally considered a financially conservative capital structure.
- A ratio between 0.3 and 0.5 suggests a moderate level of leverage that is sustainable for most healthy companies.
Industry Context
The acceptable range for the D/A ratio is highly dependent on the industry.
- Utilities, airlines, and manufacturing companies are naturally asset-intensive and rely heavily on debt to finance large-scale infrastructure and equipment. They often operate sustainably with higher D/A ratios.
- Technology, healthcare, and software companies tend to have lower asset bases and can be cash-rich, allowing them to operate with much lower D/A ratios.
Busting Common Myths about Debt Ratios
Using only a single metric like the debt to total assets ratio can be misleading. Here are a few common myths that analysts must be aware of:
- Myth 1: "A low D/A always means strong stability." While a low ratio signals a conservative capital structure, it can also mean a company is under-utilizing leverage to fuel growth. Borrowing can be a powerful tool when used effectively.
- Myth 2: "A high D/A always signals risk." As noted, industries like utilities operate sustainably with high ratios. If a company can consistently generate stable cash flow to service its debt, a high D/A ratio may not be a red flag.
- Myth 3: "Debt to Total Assets is enough for solvency analysis." This ratio provides only one piece of the puzzle. It ignores a company's liquidity (its ability to meet short-term obligations), its interest burden, and its ability to generate cash flow to service its debt.
Beyond Debt to Total Assets - Complementary Ratios
To build a complete picture of a company's solvency, a skilled analyst must use a basket of complementary ratios.
- Debt-to-Equity Ratio: Measures the leverage a company uses relative to the capital provided by its shareholders.
- Current Ratio & Quick Ratio: Assess a company's ability to meet its short-term liabilities with its short-term assets.
- Interest Coverage Ratio: Measures a company's ability to service its interest expenses with its earnings before interest and taxes (EBIT).
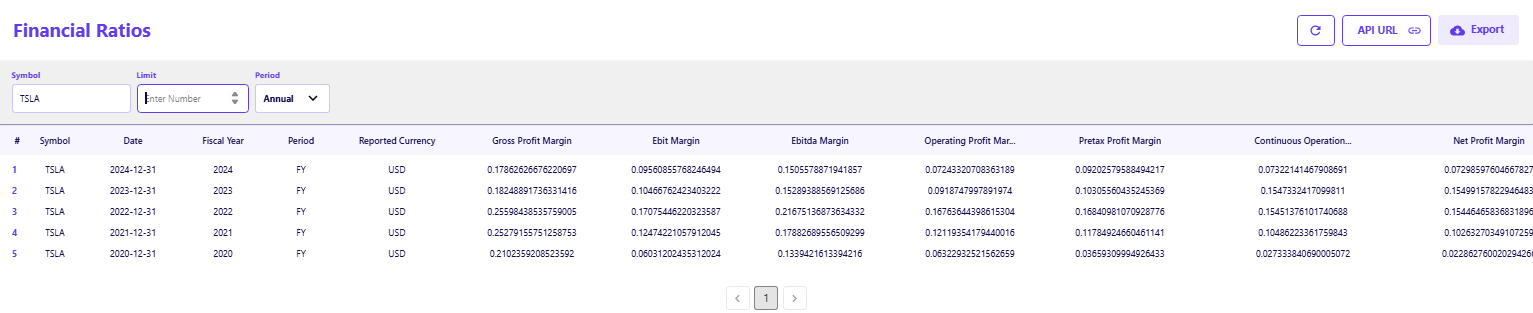
With the Financial Ratios API, analysts can access thousands of leverage and solvency ratios such as Debt-to-Equity, Interest Coverage, and Current Ratio without manual calculations.
Strategic Takeaway
Analysts must use a basket of ratios to understand solvency fully. For instance, a company with a high D/A ratio might still be a strong investment if its cash flow-based metrics and liquidity ratios are robust. APIs make this ratio comparison scalable across sectors and timeframes.
Practical Applications for Analysts
The debt to total assets ratio is a powerful tool for:
- Screening for solvency risk: Analysts can use it to quickly filter thousands of companies to identify those with dangerously high leverage, which is a common practice in distressed credit research.
- Benchmarking against peers: Comparing Tesla's D/A ratio to that of its competitors provides insight into its relative financial strength in the automotive industry.
- Assessing stability: Lenders and investors use this ratio to assess a company's financial health before issuing credit or making an investment.
Test the Debt-to-Assets ratio for Tesla and its peers instantly using the FMP Balance Sheet Statement API ideal for cross-company solvency screens.”
The Debt to Assets Lens on Stability
The debt to total assets ratio is a powerful analytical tool that shows how much of a company's assets are debt-financed. As the Tesla case study demonstrates, it provides clear insight into a company's deleveraging trends and capital structure. However, this ratio must be read in context, considering industry standards, peer benchmarks, and other solvency metrics. Modern data APIs not only simplify the calculation but also enable analysts to perform this comprehensive analysis at scale, eliminating manual inconsistencies and providing a deeper, more robust understanding of a company's financial stability.
Explore FMP's datasets to deepen your leverage and solvency analysis across industries. To take your analysis to the next level and identify potential red flags, explore how to use financial data to How to Spot Hidden Liquidity Risks in Balance Sheets Before Markets Do.
FAQs
How do you calculate the debt to total assets ratio?
The ratio is calculated by dividing a company's total liabilities by its total assets. Both figures can be found on the company's balance sheet.
What is a good debt to total assets ratio?
A ratio of 0.5 or lower is generally considered safe, while anything below 0.3 is very conservative. The definition of a "good" ratio, however, is heavily dependent on the industry.
Why is this ratio important for financial stability?
It reveals a company's financial leverage and indicates how much of its assets are funded by debt. A high ratio signals greater risk, as the company may struggle to meet its debt obligations, especially during economic downturns.
How does Tesla's debt to assets ratio compare to peers?
Tesla's D/A ratio has been trending downward, signaling a move towards a more conservative capital structure. When benchmarking, analysts should compare it to direct peers like Ford or General Motors to get a clear picture of its relative financial strength.
What's the difference between debt to assets and debt to equity ratio?
The debt to assets ratio measures the proportion of a company's assets financed by debt. The debt to equity ratio measures a company's leverage relative to its shareholder capital. Both are key solvency metrics.
Can debt to assets ratio be negative?
No, the debt to assets ratio cannot be negative because both total liabilities and total assets are non-negative values.
How do analysts use APIs to calculate solvency ratios at scale?
APIs like the FMP Balance Sheet Statement API and the Financial Ratios API provide normalized and easily accessible data for thousands of companies. This automation allows analysts to run large-scale screens and track trends across entire sectors in real time, saving significant time and reducing errors.

Top 5 Defense Stocks to Watch during a Geopolitical Tension
In times of rising geopolitical tension or outright conflict, defense stocks often outperform the broader market as gove...

Circle-Coinbase Partnership in Focus as USDC Drives Revenue Surge
As Circle Internet (NYSE:CRCL) gains attention following its recent public listing, investors are increasingly scrutiniz...

LVMH Moët Hennessy Louis Vuitton (OTC:LVMUY) Financial Performance Analysis
LVMH Moët Hennessy Louis Vuitton (OTC:LVMUY) is a global leader in luxury goods, offering high-quality products across f...

