FMP
The Competitive Moat Index: Using KPI Convergence and Divergence to Identify Future Winners
Dec 23, 2025
Every analyst talks about "moats," but few quantify them effectively. We often rely on qualitative descriptors like "network effects" or "brand power" without testing whether those advantages are mathematically expanding or contracting. In a market driven by hard numbers, a moat is not a static castle; it is a measurable rate of change relative to the competition.
This article introduces the Competitive Moat Index, a repeatable narrative framework for evaluating these shifts across any sector. Our core hypothesis is simple but testable: competitive moats can be evaluated by measuring whether key KPIs diverge from or converge toward peers over time. By tracking this directionality, analysts can identify whether a company's structural advantage is deepening (divergence) or eroding (convergence) long before it hits the bottom line.
The Core Framework: Convergence vs. Divergence
The core thesis of this framework is that regression to the mean is the natural state of capitalism. If a company generates excess returns, competitors will enter the market to compete those returns away. Therefore, a flat line in a high-margin business is often a bearish signal; it suggests the company is merely holding ground rather than innovating.
To build the index, we assess two specific signal patterns. These patterns are not static labels; they are dynamic signals that evolve quarter over quarter, requiring continuous monitoring.
|
Signal Type |
Definition |
The Strategic Implication |
|
KPI Divergence |
A primary metric (e.g., Gross Margin, ROCE) expands away from the peer group average. |
Moat Widening: The company's scale is generating compounding efficiency a "flywheel" effect competitors cannot replicate. |
|
KPI Convergence |
A metric begins to mirror the broader sector (e.g., CAC alignment, margin compression). |
Moat Eroding: Pricing power is fading, and the product is becoming commoditized. |
Analysts need consistent, standardized time series data to map these trends. By leveraging the Key Metrics API, you can track these spreads systematically across your coverage universe.
Step 1: Quantifying the Cost of Defense (Segment Analysis)
The first step in the framework is to determine the price a company pays to maintain its dominance. A true wide-moat company might see top-line growth, but if the cost to "buy" that revenue grows faster, the quality of the moat is degrading (Convergence).
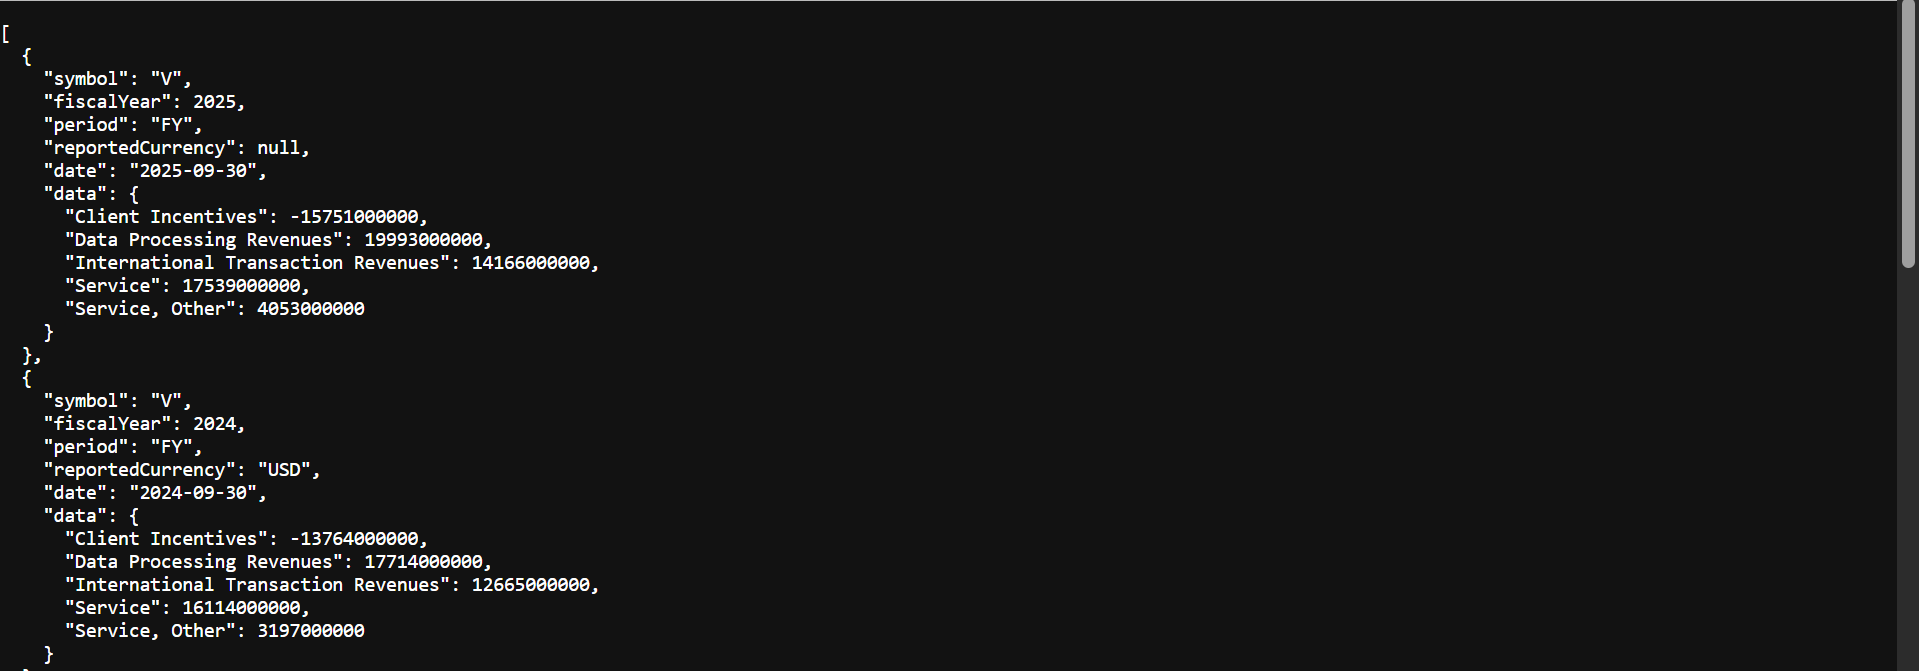
We can analyze this by dissecting segment-level data. Using the Revenue Product Segmentation API, we can isolate contra-revenue items or acquisition costs often buried in the notes.
Visa's Incentive Burden
For Visa, the "cost of defense" is explicit in the line item "Client Incentives" payments made to banks to ensure they issue Visa cards.
- 2020 Baseline: Visa generated approximately 28.5 billion dollars in gross revenue. Client incentives were 6.66 billion dollars.
- Incentive Burden: 23.3%
- 2025 Status: Gross revenue expanded to approximately 55.7 billion dollars. Client incentives ballooned to 15.75 billion dollars.
- Incentive Burden: 28.2%
How to Replicate This Analysis:
You can perform this exact check for any company in your coverage. Visit the Revenue Product Segmentation API documentation to access the endpoint.
- Get Your Key: Sign up to generate your unique API key.
- Swap the Ticker: In the API URL, simply replace the default ticker (e.g., AAPL) with the company you are analyzing (e.g., V for Visa or BA for Boeing) to instantly retrieve the granular revenue breakdown shown above.
The Signal: While Visa's "Data Processing Revenues" nearly doubled from 10.9 billion dollars to 19.9 billion dollars over this period, the cost to defend that volume rose significantly. This particular metric serves as a textbook example of KPI convergence: despite top-line growth, the "maintenance capex" required to defend market share is regressing toward the industry average, signaling a more expensive competitive environment. An analyst ignoring this type of advanced KPI analysis risks overestimating future operating leverage.
Step 2: Verifying Structural Efficiency (Key Metrics)
While the cost of defense may rise, a resilient moat counters this pressure with supreme operational efficiency. The second step of the framework looks for divergence in return ratios. Most mature firms become bloated as they scale; a company that defies this gravity signals a strong structural advantage.
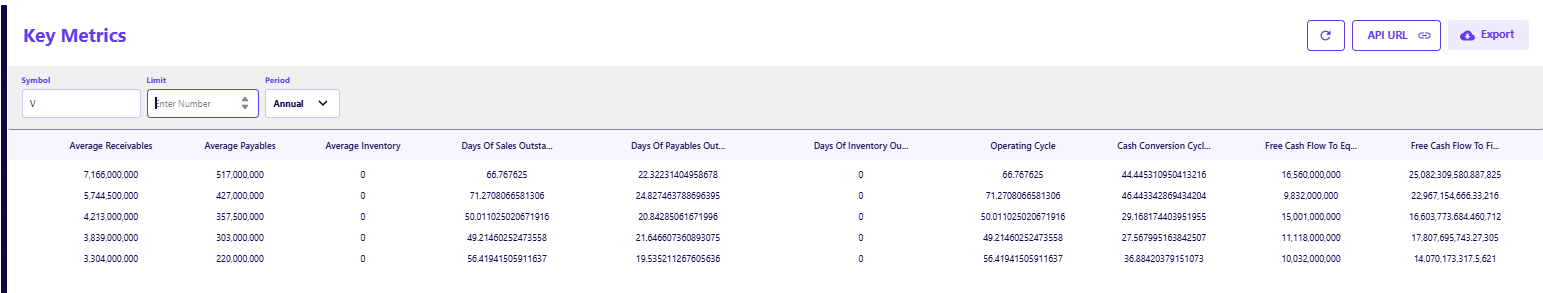
Using the Key Metrics API, we can isolate specific efficiency ratios to validate the business model:
- Capex to Revenue: Measures capital intensity.
- Return on Capital Employed (ROCE): Measures how well capital is used to generate profit.
- Cash Conversion Cycle (CCC): Measures the speed of converting inputs into cash.
Visa's Split Signal
Wide-moat businesses rarely show uniform strength across all numbers; they often present "split signals" where one metric degrades while another shines. This complexity is precisely why single-metric analysis fails and a comprehensive framework is necessary. Despite the rising incentive costs, Visa's efficiency metrics show a complex picture that requires nuanced analysis using multiple data points from the Key Metrics endpoint:
- The Divergence (Positive):
- Capex to Revenue (2025): ~0.035 (3.5%). For a company generating over 30 billion dollars in net revenue, requiring less than 4 cents of every dollar for capital expenditures is a clear divergence from the market average.
- ROCE (2024): ~41%. This confirms that the capital actually employed in the business continues to generate returns far above the weighted average cost of capital (WACC).
- The Convergence (Negative Warning):
- Cash Conversion Cycle: In 2021, the cycle was approximately 27.5 days. By 2025, it extended to 66.7 days.
- Drivers: This was driven by Days Sales Outstanding (DSO) rising from roughly 49 days (2021) to 66 days (2025). This suggests that while Visa is efficient with capital assets, it is taking longer to collect cash from customers a friction point that often precedes margin compression.
Why this matters: A degrading cash cycle is often a leading indicator of margin compression. When collections slow, companies are forced to absorb higher financing costs, offer pricing concessions to close deals, or increase incentives to sustain volume—all of which eventually erode the bottom line.
This split signal - elite asset efficiency but degrading cash cycle - demonstrates why a comprehensive framework is necessary. You cannot rely on a single metric.
Step 3: Stress-Testing with 2026-2027 Estimates
Historical data confirms the moat exists today, but markets price assets based on durability. The final step is to overlay historical trends with forward-looking consensus data to test the "Operating Leverage Hypothesis" for the coming fiscal years (2026-2027).
You can access consensus paths via the Financial Estimates API. The goal is to compare the slope of the revenue curve against the EBITDA curve:
- Positive Leverage: EBITDA growth > Revenue growth (Moat Widening).
- Negative Leverage: EBITDA growth < Revenue growth (Moat Eroding).
The 2026-2027 Outlook
Using the estimates data, we can project the market's view on Visa's ability to maintain its moat:
- 2026 Projections: Revenue ~44.4 billion dollars, EBITDA ~30.5 billion dollars.
- 2027 Projections: Revenue ~48.9 billion dollars, EBITDA ~33.7 billion dollars.
The Calculation:
- Revenue Growth (2026-2027): 10.1%
- EBITDA Growth (2026-2027): 10.5%
The Verdict: The estimates suggest neutral operating leverage. Despite the rising "Incentive Burden" identified in Step 1, the market expects Visa to maintain its margins perfectly through 2027.
To confirm moat erosion versus resilience in future revisions, watch the spread: if EBITDA estimates revise downward while Revenue estimates stay flat, it confirms the "cost of defense" is eating into profitability. If EBITDA revisions outpace revenue, the moat is widening. This approach allows you to benchmark future growth quantitatively rather than relying on management guidance alone.
From Static Castles to Dynamic Moats
A competitive moat is not a feeling; it is a function of financial performance over time. This framework quantifying the cost of defense, verifying structural efficiency, and stress-testing with forward estimates provides a repeatable methodology for any sector.
The logic holds regardless of the industry.Whether you are analyzing a payment processor like Visa, a SaaS platform, or an industrial manufacturer, the process remains the same. Stop asking if a company has a moat. Start measuring if the KPI spreads are widening or narrowing. By integrating these specific API endpoints into your workflow, you move from static SWOT analysis to dynamic, predictive risk assessment.
Frequently Asked Questions
What is the difference between KPI convergence and divergence?
KPI divergence occurs when a company's metrics (like margins or return on capital) move away from the industry average, signaling a strengthening competitive advantage. Convergence happens when those metrics regress toward the average, indicating commoditization or increased competition.
Why is "Client Incentives" a critical metric for payment companies?
Client incentives are contra-revenue items; they represent the cash paid to banks to issue cards. Tracking this metric relative to gross revenue reveals the "price" the company pays to maintain its market share. A rising ratio suggests the competitive environment is becoming more expensive.
How does Capex to Revenue indicate a competitive moat?
A consistently low Capex to Revenue ratio (e.g., below 5%) in a scaling business indicates a "network effect" or asset-light model. It means the company can grow without requiring proportional capital investment, leading to higher free cash flow conversion compared to capital-intensive peers.
Can I use this framework for non-financial companies?
Yes. For retailers, you might track "Same Store Sales" divergence. For SaaS companies, you might track "Net Revenue Retention" (NRR). The principle remains the same: is the key metric pulling away from the pack or blending in?
Why are efficiency ratios considered "truth serums"?
Management can often adjust "Adjusted EBITDA" or tell a compelling narrative on earnings calls. However, efficiency ratios like Return on Capital Employed (ROCE) or Asset Turnover are harder to manipulate. They reflect the raw mechanics of how effectively the company uses capital to generate value.
How do I access segment-level data for this analysis?
You can access specific revenue breakdowns using the Revenue Product Segmentation API, which provides line-item details like "Service Revenue" or "Client Incentives" often buried in the notes of financial statements.
What is the "Operating Leverage Hypothesis"?
This is the assumption that as a company grows revenue, its margins should expand because fixed costs are spread over a larger base. If EBITDA growth is faster than revenue growth, operating leverage is positive (moat widening). If it lags, operating leverage is negative (moat eroding).

Top 5 Defense Stocks to Watch during a Geopolitical Tension
In times of rising geopolitical tension or outright conflict, defense stocks often outperform the broader market as gove...

Circle-Coinbase Partnership in Focus as USDC Drives Revenue Surge
As Circle Internet (NYSE:CRCL) gains attention following its recent public listing, investors are increasingly scrutiniz...

LVMH Moët Hennessy Louis Vuitton (OTC:LVMUY) Financial Performance Analysis
LVMH Moët Hennessy Louis Vuitton (OTC:LVMUY) is a global leader in luxury goods, offering high-quality products across f...

