FMP
Why ROIC and WACC Matter for Picking Winning Stocks and How to Get Those Values Using FMP and Google Sheets.
Jun 02, 2025
What is ROIC and WACC?
Return on Invested Capital (ROIC) measures how efficiently a company uses its capital (equity and debt) to generate profits. It's calculated as:
ROIC = Net Operating Profit After Tax (NOPAT) / Invested Capital
A high ROIC shows a company is good at turning capital into earnings.
Weighted Average Cost of Capital (WACC) is the average rate a company pays to finance its operations through debt and equity. It's essentially the “hurdle rate” a company must beat to create value.
WACC = (Equity % × Cost of Equity) + (Debt % × Cost of Debt × (1 - Tax Rate))
Why Compare ROIC to WACC?
Comparing ROIC to WACC tells you if a company is creating or destroying value. If ROIC > WACC, the company generates returns above its financing costs, creating value for shareholders. If ROIC < WACC, it's burning capital, which is a red flag. A consistently high ROIC-WACC spread signals a business with a competitive edge, often called an “economic moat.”
How Traders Can Use ROIC vs. WACC to Find Great Stocks
- Screen for High ROIC: Look for companies with ROIC above 10-15%, indicating efficient capital use.
- Compare to WACC: A stock is attractive if ROIC significantly exceeds WACC (e.g., ROIC of 20% vs. WACC of 8%). This shows the company is generating excess returns.
- Check Consistency: Focus on firms with stable or rising ROIC over 5-10 years, as this suggests a durable business model.
- Combine with Other Metrics: Use ROIC-WACC alongside P/E, debt-to-equity, or revenue growth to confirm a stock's potential.
Example: A tech company with an ROIC of 25% and WACC of 7% is likely a strong candidate, as it's creating substantial value. Compare this to a utility with an ROIC of 5% and WACC of 6%—it's barely breaking even on capital costs.
Now let's consider how to extract ROIC and WACC values for your selected stock using the FMP and GOOGLE sheets.
First, connect Google Sheets to FMP using the instructions for extracting ROIC and WACC values.
After connecting everything and getting your custom API key, go to any empty cell inside your Google Sheets and use this formula =fmpAdvancedDCF(A2,A4) where A2 is the cell with the stock ticker (to extract values for your selected stock) and A4 is the name of the value that you want to extract as shown on the picture below.
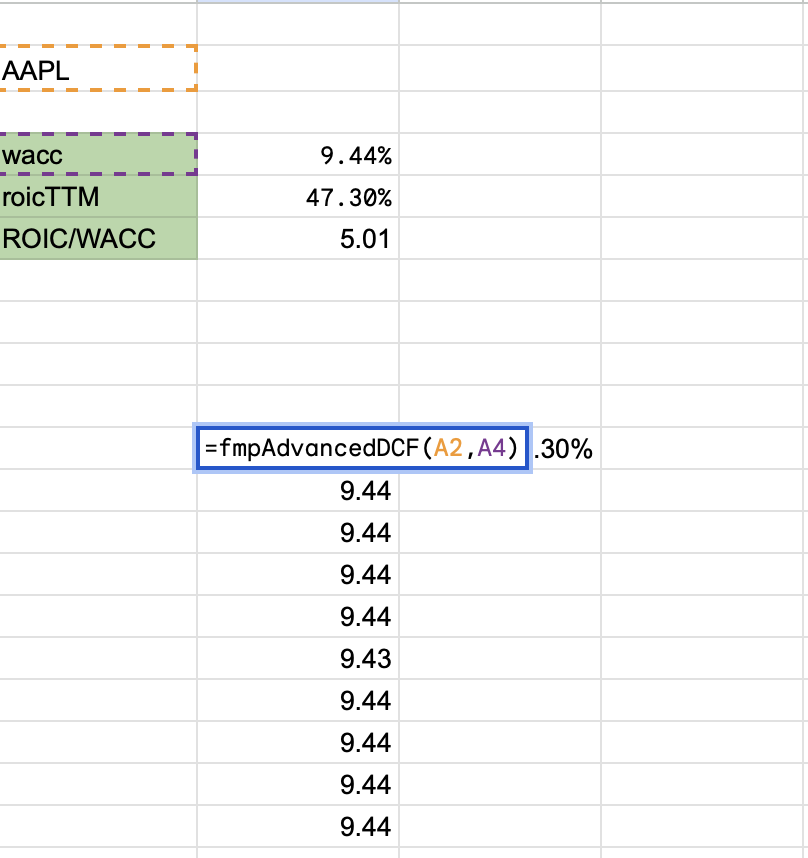
After that, hit the enter button and you will get the WACC value for your selected stock.
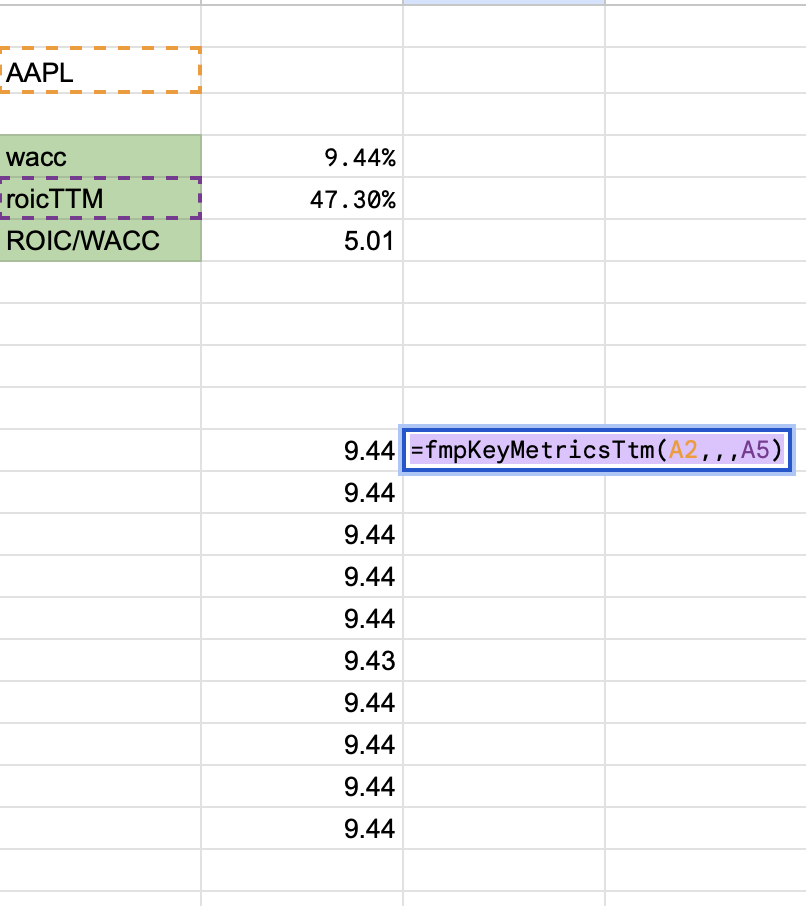
The next step is to extract ROIC value. Go to the empty cell inside your GoogleSheets and use this formula =fmpKeyMetricsTtm(A2,,,A5) where A2 is the name of the stock and A5 is the name of the value, use the exact formula, the same formula that I shared. The example of the formula usage can be seen on the picture below.
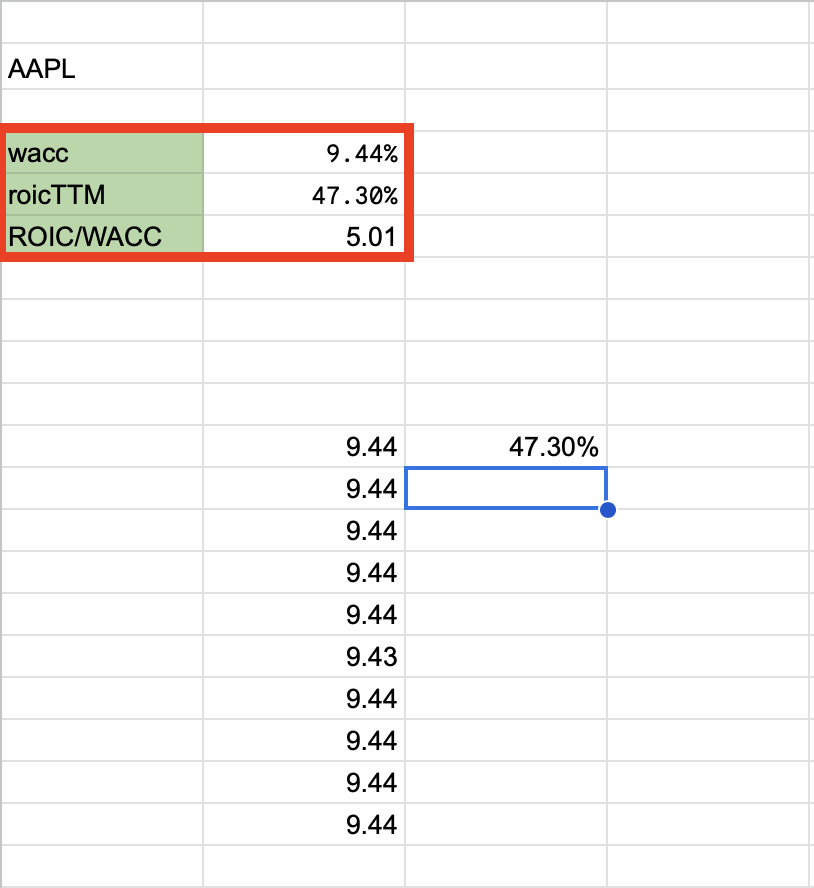
After that, hit the enter button and you will get your WACC value. You can build the separate table to see your extracted ROIC and WACC values and also the ROIC/WACC ratio, by dividing the ROIC on WACC. Based on the extracted values, AAPL is using its attracted funds efficiently, generating higher returns than the costs that it bears on its attracted funds. Now you can extract AAPL's closest peers (similar stocks) and do the same analysis and pick the stock with the highest ROIC/WACC ratio. That's how you can make sure that you are picking a great stock that has great returns that exceed its cost of capital.
I hope my article was useful and now you are able to find interesting stocks that generate high returns, on its attracted funds.

Top 5 Defense Stocks to Watch during a Geopolitical Tension
In times of rising geopolitical tension or outright conflict, defense stocks often outperform the broader market as gove...

Circle-Coinbase Partnership in Focus as USDC Drives Revenue Surge
As Circle Internet (NYSE:CRCL) gains attention following its recent public listing, investors are increasingly scrutiniz...

LVMH Moët Hennessy Louis Vuitton (OTC:LVMUY) Financial Performance Analysis
LVMH Moët Hennessy Louis Vuitton (OTC:LVMUY) is a global leader in luxury goods, offering high-quality products across f...

