FMP
Analyzing AMD stock and defining the strength of the trend.
Jun 12, 2025 4:10 PM - Sanzhi Kobzhan


Image credit: AMD stock analysis
Few words about Advanced Micro Devices
Advanced Micro Devices (AMD) has emerged as a powerhouse in the semiconductor industry, carving out a significant presence in markets ranging from data centers and gaming to artificial intelligence (AI) and embedded systems. With its stock listed on NASDAQ under the ticker AMD, the company has garnered attention from investors seeking exposure to the rapidly evolving tech sector. Under the leadership of CEO Lisa Su, AMD has transformed from a secondary player into a formidable competitor, challenging industry giants like NVIDIA (NVDA) and Intel (INTC). Its innovative product portfolio, including EPYC server processors, Ryzen CPUs, and Instinct GPUs, positions AMD to capitalize on the growing demand for high-performance computing and AI solutions.
AMD's competitors
AMD faces stiff competition in the semiconductor space, primarily from NVIDIA, the dominant force in GPUs and AI chips, and Intel, a long-standing leader in CPUs. NVIDIA's strength lies in its CUDA software ecosystem and over 80% market share in AI-capable GPUs, making it the go-to choice for AI training workloads. Intel, while lagging in the AI chip race, remains a key player in CPUs and is expanding its GPU and AI offerings. Other competitors include tech giants like Amazon, Alphabet, and Qualcomm, who are developing in-house AI chips, though their market impact remains limited. Despite this competitive landscape, AMD's open-source ROCm platform and cost-effective Instinct MI300X GPUs are gaining traction, particularly in AI inference, where AMD is closing the gap with NVIDIA.
AMD's fundamentals
Fundamentally, AMD is robust due to its diversified revenue streams across data centers (25% of the x86 server market), gaming, and embedded systems, bolstered by strategic acquisitions like Xilinx and Nod.ai. In its latest quarter, AMD reported a 57% year-over-year increase in data center revenue to $3.7 billion, reflecting strong demand for its AI and server products. Its forward price-to-earnings (P/E) ratio of approximately 28x, compared to NVIDIA's 32x, suggests a more attractive valuation relative to its growth prospects. Analysts are optimistic, with 63% of those surveyed by TipRanks assigning AMD a “buy” rating, projecting a 26.2% upside potential with an average price target of $191.45.
Why AMD is a good alternative to NVDA shares.
As an alternative to NVIDIA shares, AMD offers compelling advantages. While NVIDIA dominates AI chip sales, its high valuation and massive $39.1 billion data center revenue base make it more susceptible to the law of large numbers, potentially capping future growth rates. AMD, with a smaller $3.7 billion data center revenue base, has more room to grow, particularly in the expanding AI inference market, where its MI300X chips are competitively priced—four MI300X GPUs cost roughly the same as one NVIDIA H100. Additionally, AMD's open-source ROCm framework, supported by frameworks like TensorFlow and PyTorch, reduces dependency on NVIDIA's proprietary CUDA, appealing to developers seeking flexibility. For investors seeking a blend of growth potential, reasonable valuation, and exposure to AI and computing trends, AMD stands out as a strong alternative to NVIDIA, with the potential to capture significant market share in the years ahead.
Define the strength of the trend
Now when you know what AMD's strong sides are and why it's a good alternative to NVDA shares, let's try to define the strength of the trend and try to forecast the future price movements. But first keep in mind that it's not possible to forecast the stock price accurately as there are so many factors that come into play. We can only define the strength of the trend to bet on future moves but can't forecast the price accurately. To lower market risk, use portfolio management models or derivative instruments.
We will be using a Stock News and Forecast Chrome Extension to analyze the trend and try to make price move forecasts and see what analysts think of AMD stock now.
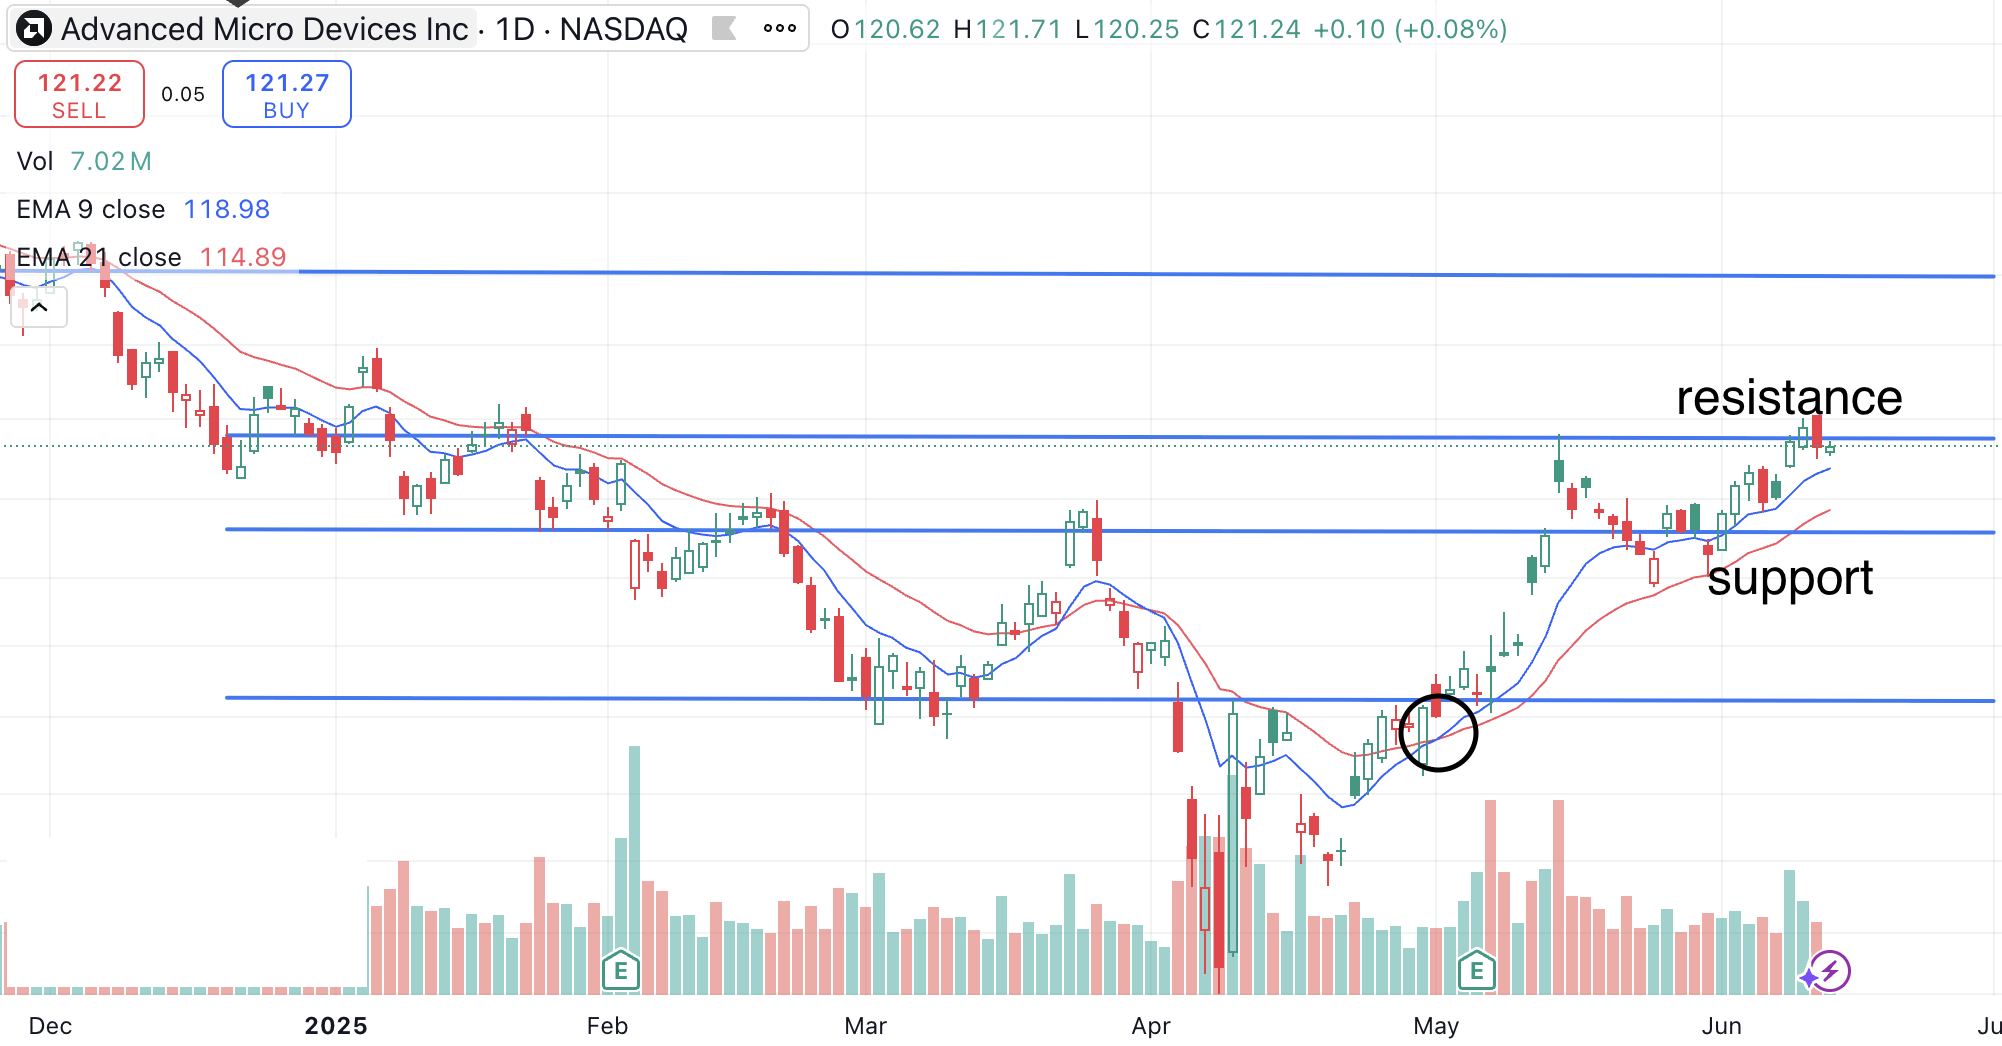
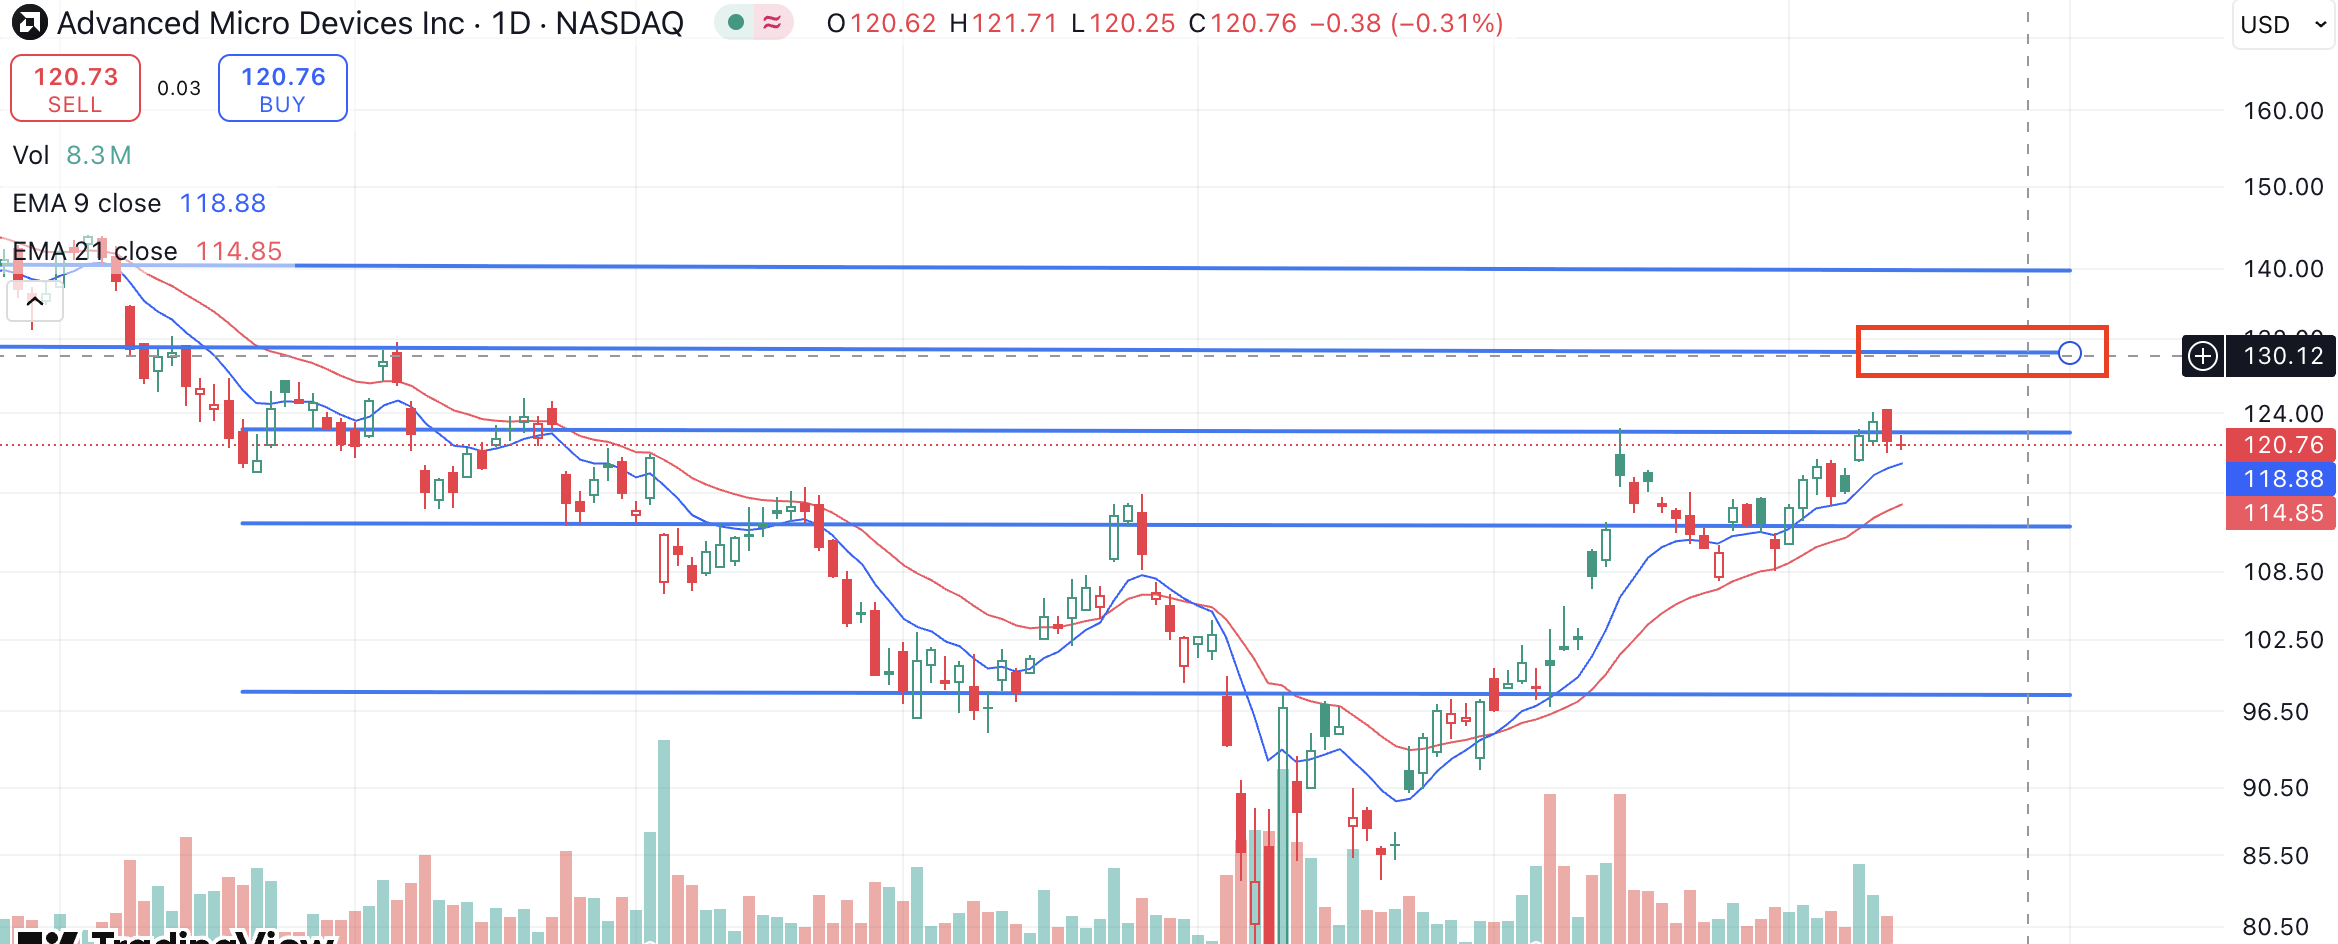
First, let's look at the stock graph. The picture below. I am using 9-day EMA and 21-day EMA indicators and Japanese candlesticks with a daily interval (one trading day represents one candle). As you can see on the graph, the 9-day EMA (blue line) crossed the 21-day EMA upwards on the 1st of May (black circle), indicating that the upside trend has started. Moreover, the stock price is still above both EMA lines, which indicates that the upside trend is still there. But you see that the difference between the 9-day EMA and 21-day EMA is getting smaller, this suggests that the shorter-term upside trend may end soon. Moreover, the stock is approaching its resistance level, which can indicate that the stock can go lower soon, if the big seller still did not finish selling the share.
Now, let's use the Stock News and Forecast Extension to see what analysts think of AMD shares and what the news surrounding the stock is. To use the extension, get a custom API key from FMP and input it into the field that says “Enter your API key”. You need this key to extract stock news, target prices, and analyst financial estimates.
Top news affecting AMD stock.
After getting custom api key, inout the stock ticker in the Stock News field and press the Show analysis button. Examine stock news to understand where the stock price can go and if analysts think that the stock is still strong fundamentally. Below is the example of the news (highlighted red).
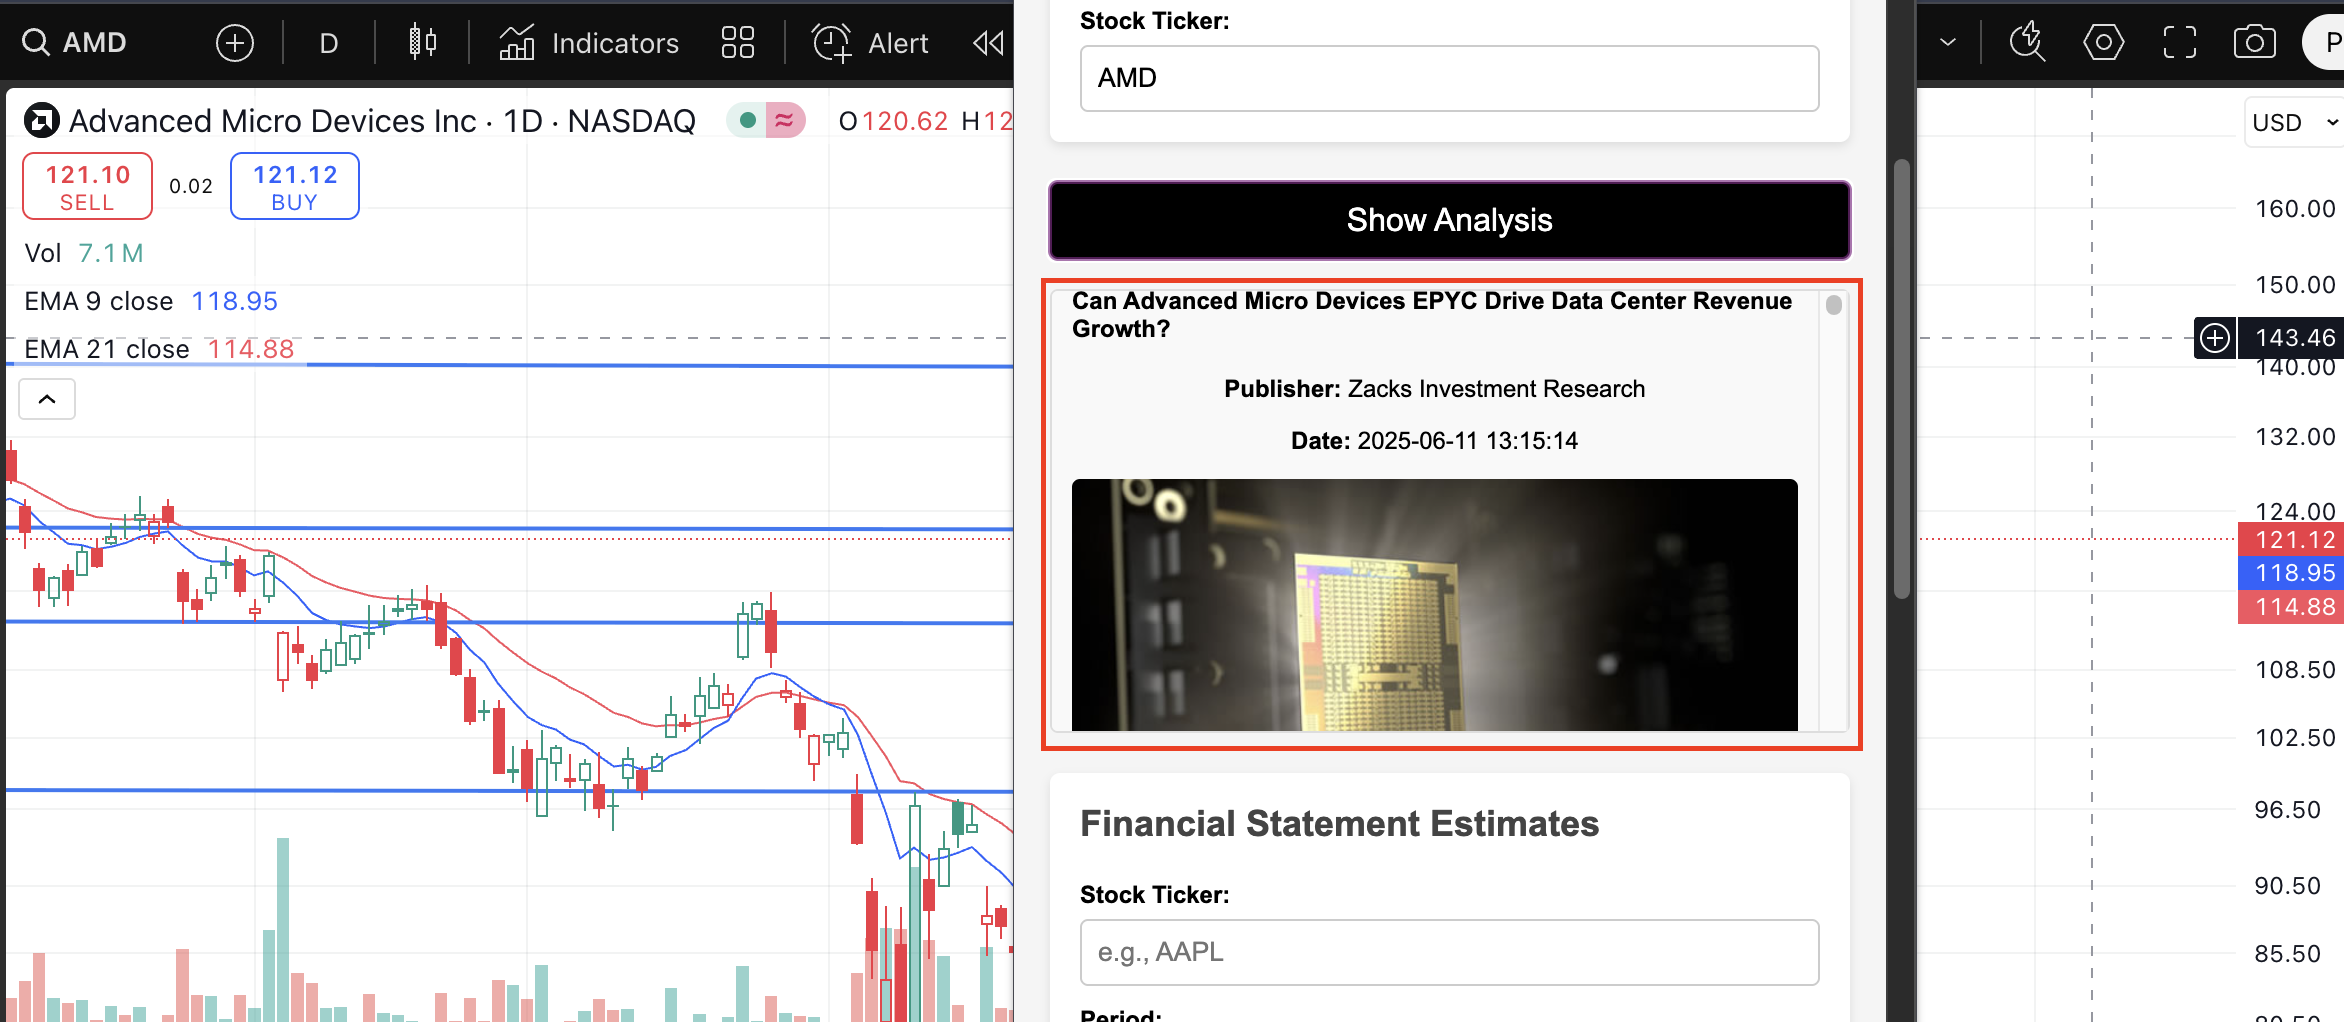
The news underscores AMD's strong fundamentals, particularly in the high-growth data center and AI markets, driven by EPYC and Instinct products. This positions AMD as a compelling alternative to NVIDIA, especially given its more attractive valuation. This suggests that AMD's price may go upside soon, after minor correction, if the large player start selling at the resistance level. Examine other news surrounding the stock to spot possible trader fear.
AMD's financial statements estimates
The next step is to examine financial statements estimates, made by top investment analysts. In the Financial Statement Estimates section inside the extension, input the stock ticker and choose the Quarter as period, and hit the Show analysis button. After that scroll to the first estimate as shown in the picture below, to understand what analysts are expecting on the next AMD's reporting quarter.
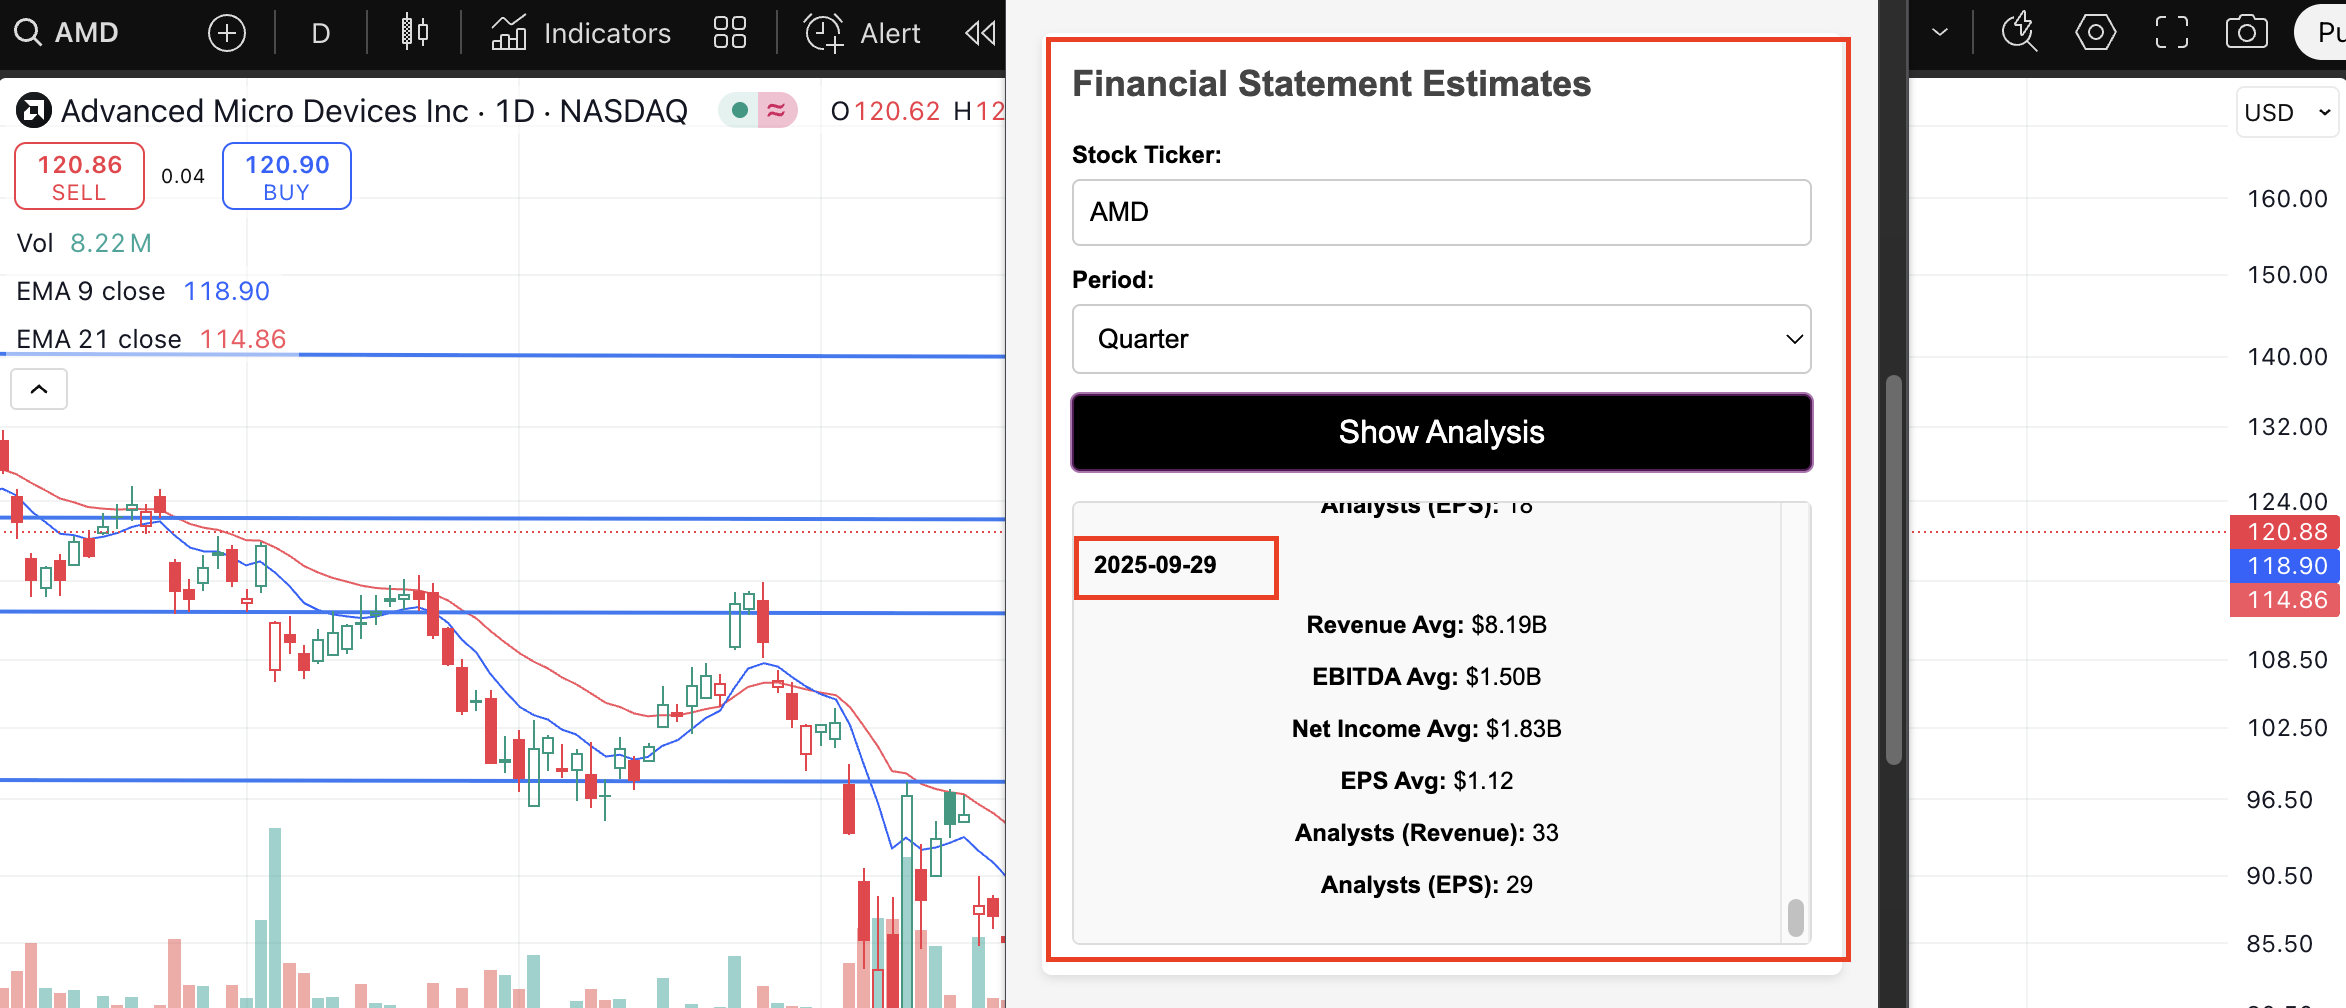
As you can see the average analyst EPS estimate is 1.12 based on 29 analyst calculations, which is higher than last Q actual EPS of 0.96. If the company posts higher actual earnings on the next reporting date it can boost the stock price. However if you analyze historical price movements on the reporting dates, it has weak positive correlation with the company reports. According to the previous report posted on 6th of May, the stock showed 1.64% EPS surprise which resulted in 2.2% price increase in 1 day. The previous report on 4th of February showed a 0.83% EPS surprise, which resulted in 9% price drop, possibly due to a speculative capital and traders closing shorter term positions. Thats why if the company posts better than expected earnings, they will not necessarily result in the price upside. Thats why its also important to monitor news surrounding the company at least one week before it posts its earnings, to understand investor sentiment and where the price trend can go.
AMD's price targets
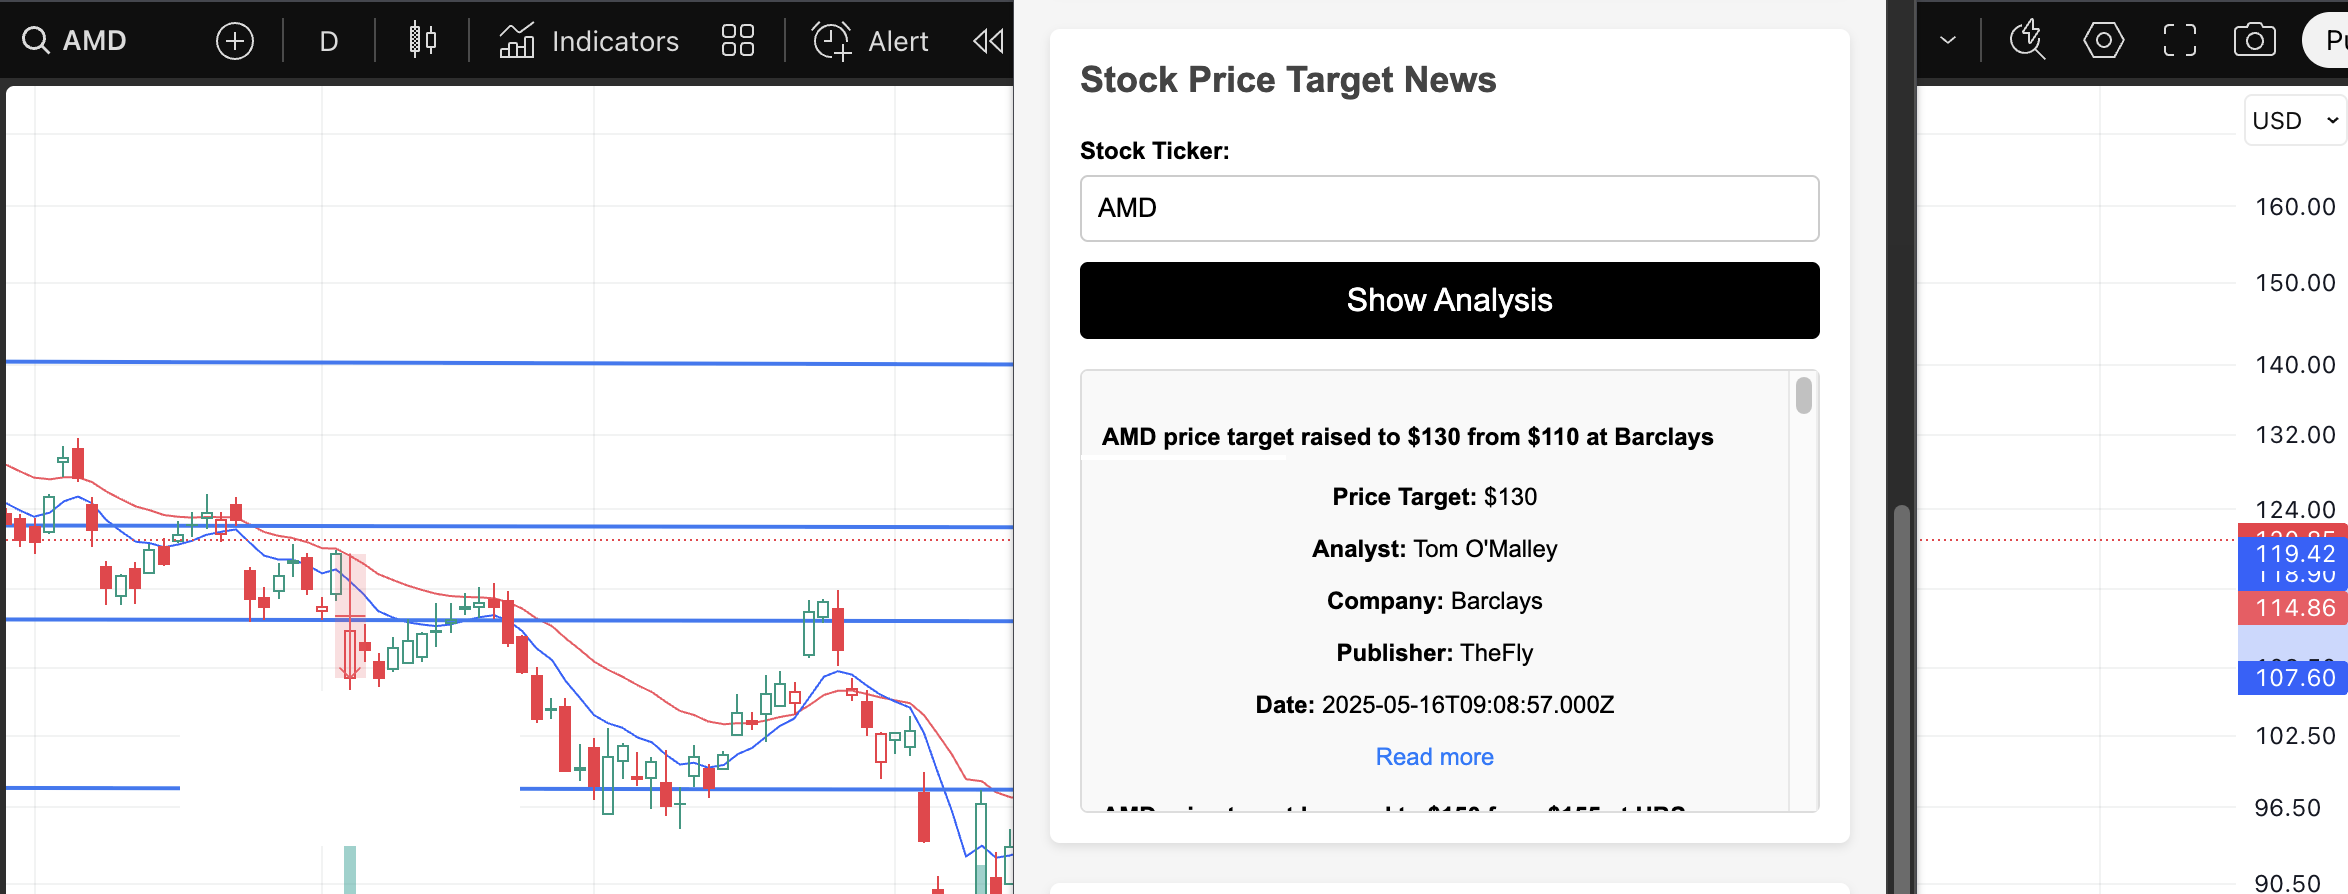
Now analyze price targets calculated by different top investment analysts. After inputting the stock ticker and pressing the Show analysis button inside the Stock Price Target News section, you can see stock target prices. See the most recent price target. As you can see in the below image, Tom O'Malley from Barclays raised AMD's target price to 130 from 110, which implies 7.5% growth potential if no negative things surrounding the company happen. Moreover, 130 fundamental price corresponds to the technical price as 130 is the next resistance level if the stock breaks the current level and starts going higher.
As you can see from the above analysis, the stock has around 7.5% growth potential based on Barclays analysts, and the next resistance level is 130, so AMD can hit that level anytime soon if no negative news surrounding the company happens. Keep an eye on the EMA indicator if the blue line (9-day EMA) starts crossing the red line (21-EMA) downwards and you see volumes going up, and the negative AMD news appears, the trend will start breaking, and we may see AMD reaching 113, the support level.
I hope you found this article interesting and now you know how to define the strength of the trend. If you are interested in building your own EMA and Japanese candlesticks in Google Sheets to forecast the strength of the trend, you can read the article How to Use EMA, Google Sheets, and FMP's Technical Indicators to Forecast the Strength of the Trend. If you are interested in building your own Chrome extension similar to the one I described and customizing it, you can read the article How to Create Your Own Stock Analysis Chrome Extension.
Other Blogs
Nov 22, 2024 5:08 AM - Parth Sanghvi
Fundamental Analysis: Principles, Types, and How to Use It
Fundamental analysis is one of the most essential tools for investors and analysts alike, helping them assess the intrinsic value of a stock, company, or even an entire market. It focuses on the financial health and economic position of a company, often using key data such as earnings, expenses, ass...

Dec 22, 2024 7:59 AM - Sanzhi Kobzhan
Two great Software Platform Stocks Similar to Palantir (PLTR)
When it comes to cutting-edge software and data analytics, Palantir Technologies (NYSE: PLTR) is often front and center. But for many investors, it’s important to consider alternative or complementary stocks in the same sector that may offer robust growth potential. As PLTR looks expensive (overvalu...

Dec 30, 2024 4:32 AM - Sanzhi Kobzhan
Walk Me Through a DCF: A Simple Guide to Discounted Cash Flow Valuation
Are you curious about how professional investors decide whether a stock might be one of the best undervalued stocks to buy now? One of the most popular tools is the Discounted Cash Flow (DCF) model. In this article, I’ll walk you through a DCF step by step. By the end, you’ll see how the Advanced DC...
