FMP
How to find your next GME stock. Select great stock with huge upside potential using FMP tools.
Jul 5, 2024 2:32 PM - Sanzhi Kobzhan


Image credit: Stock selection. How to choose stocks.
Why GME stock was so popular?
Let me share one simple way of finding your next GME stock but with great growth potential and strong fundamentals. Before we start, let me make one quick reminder: GameStop is a stock ideal for intraday trades, and its price is driven by speculative capital and high trader expectations that arise from the hype. Maybe its fundamentals will change, and the stock will be attractive from the fundamental standpoint, but when I write this article, GME's fundamentals were weak, but it has a tendency to rise fast. In this article, I want to show you an easy way of how you can find stock that not only has great growth potential but also looks attractive from the fundamental standpoint. This analysis takes slight effort, and you may not always find great shares to buy. You need to undertake this express analysis regularly as stocks' trading parameters (volatility, liquidity) change, and also, fundamentals change. A bad stock today may turn into an amazing buy idea tomorrow. Now let's start exploring this amazing and express method of finding great stocks with huge growth potential.
The first step in picking great shares.
The first step would be to see stocks with the highest trading daily volume. Increased volume means that traders are expecting something, this can be a hype around some particular stock or improved fundamentals that draw a lot of traders' attention. Filter stocks based on percentage price change as shown in the picture below.
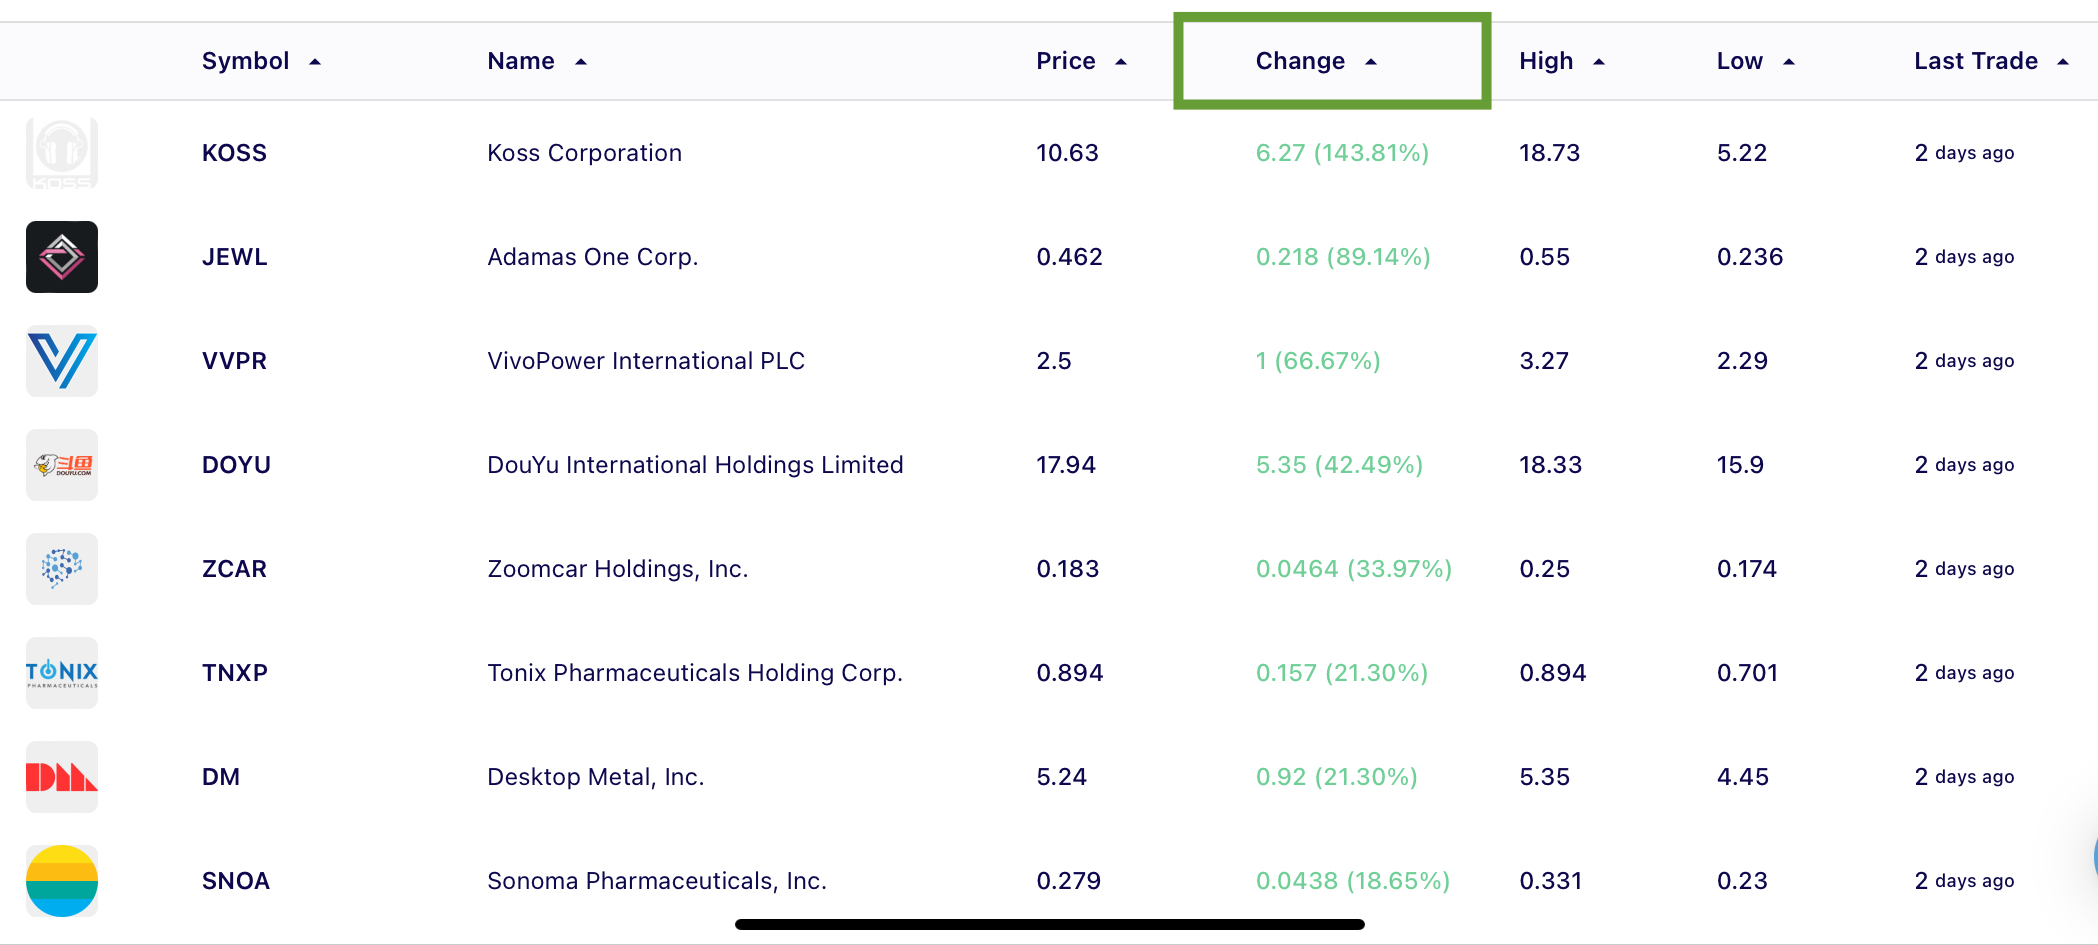
Now you see stocks that gained the most during one trading session with the highest trading volumes. Now choose one stock for further analysis. Avoid stocks that cost less than $5 not to buy junk equities, as generally stocks that cost less than $5 tend to be more volatile and not attract a lot of attention from institutional traders.
Examining stock technicals and fundamentals.
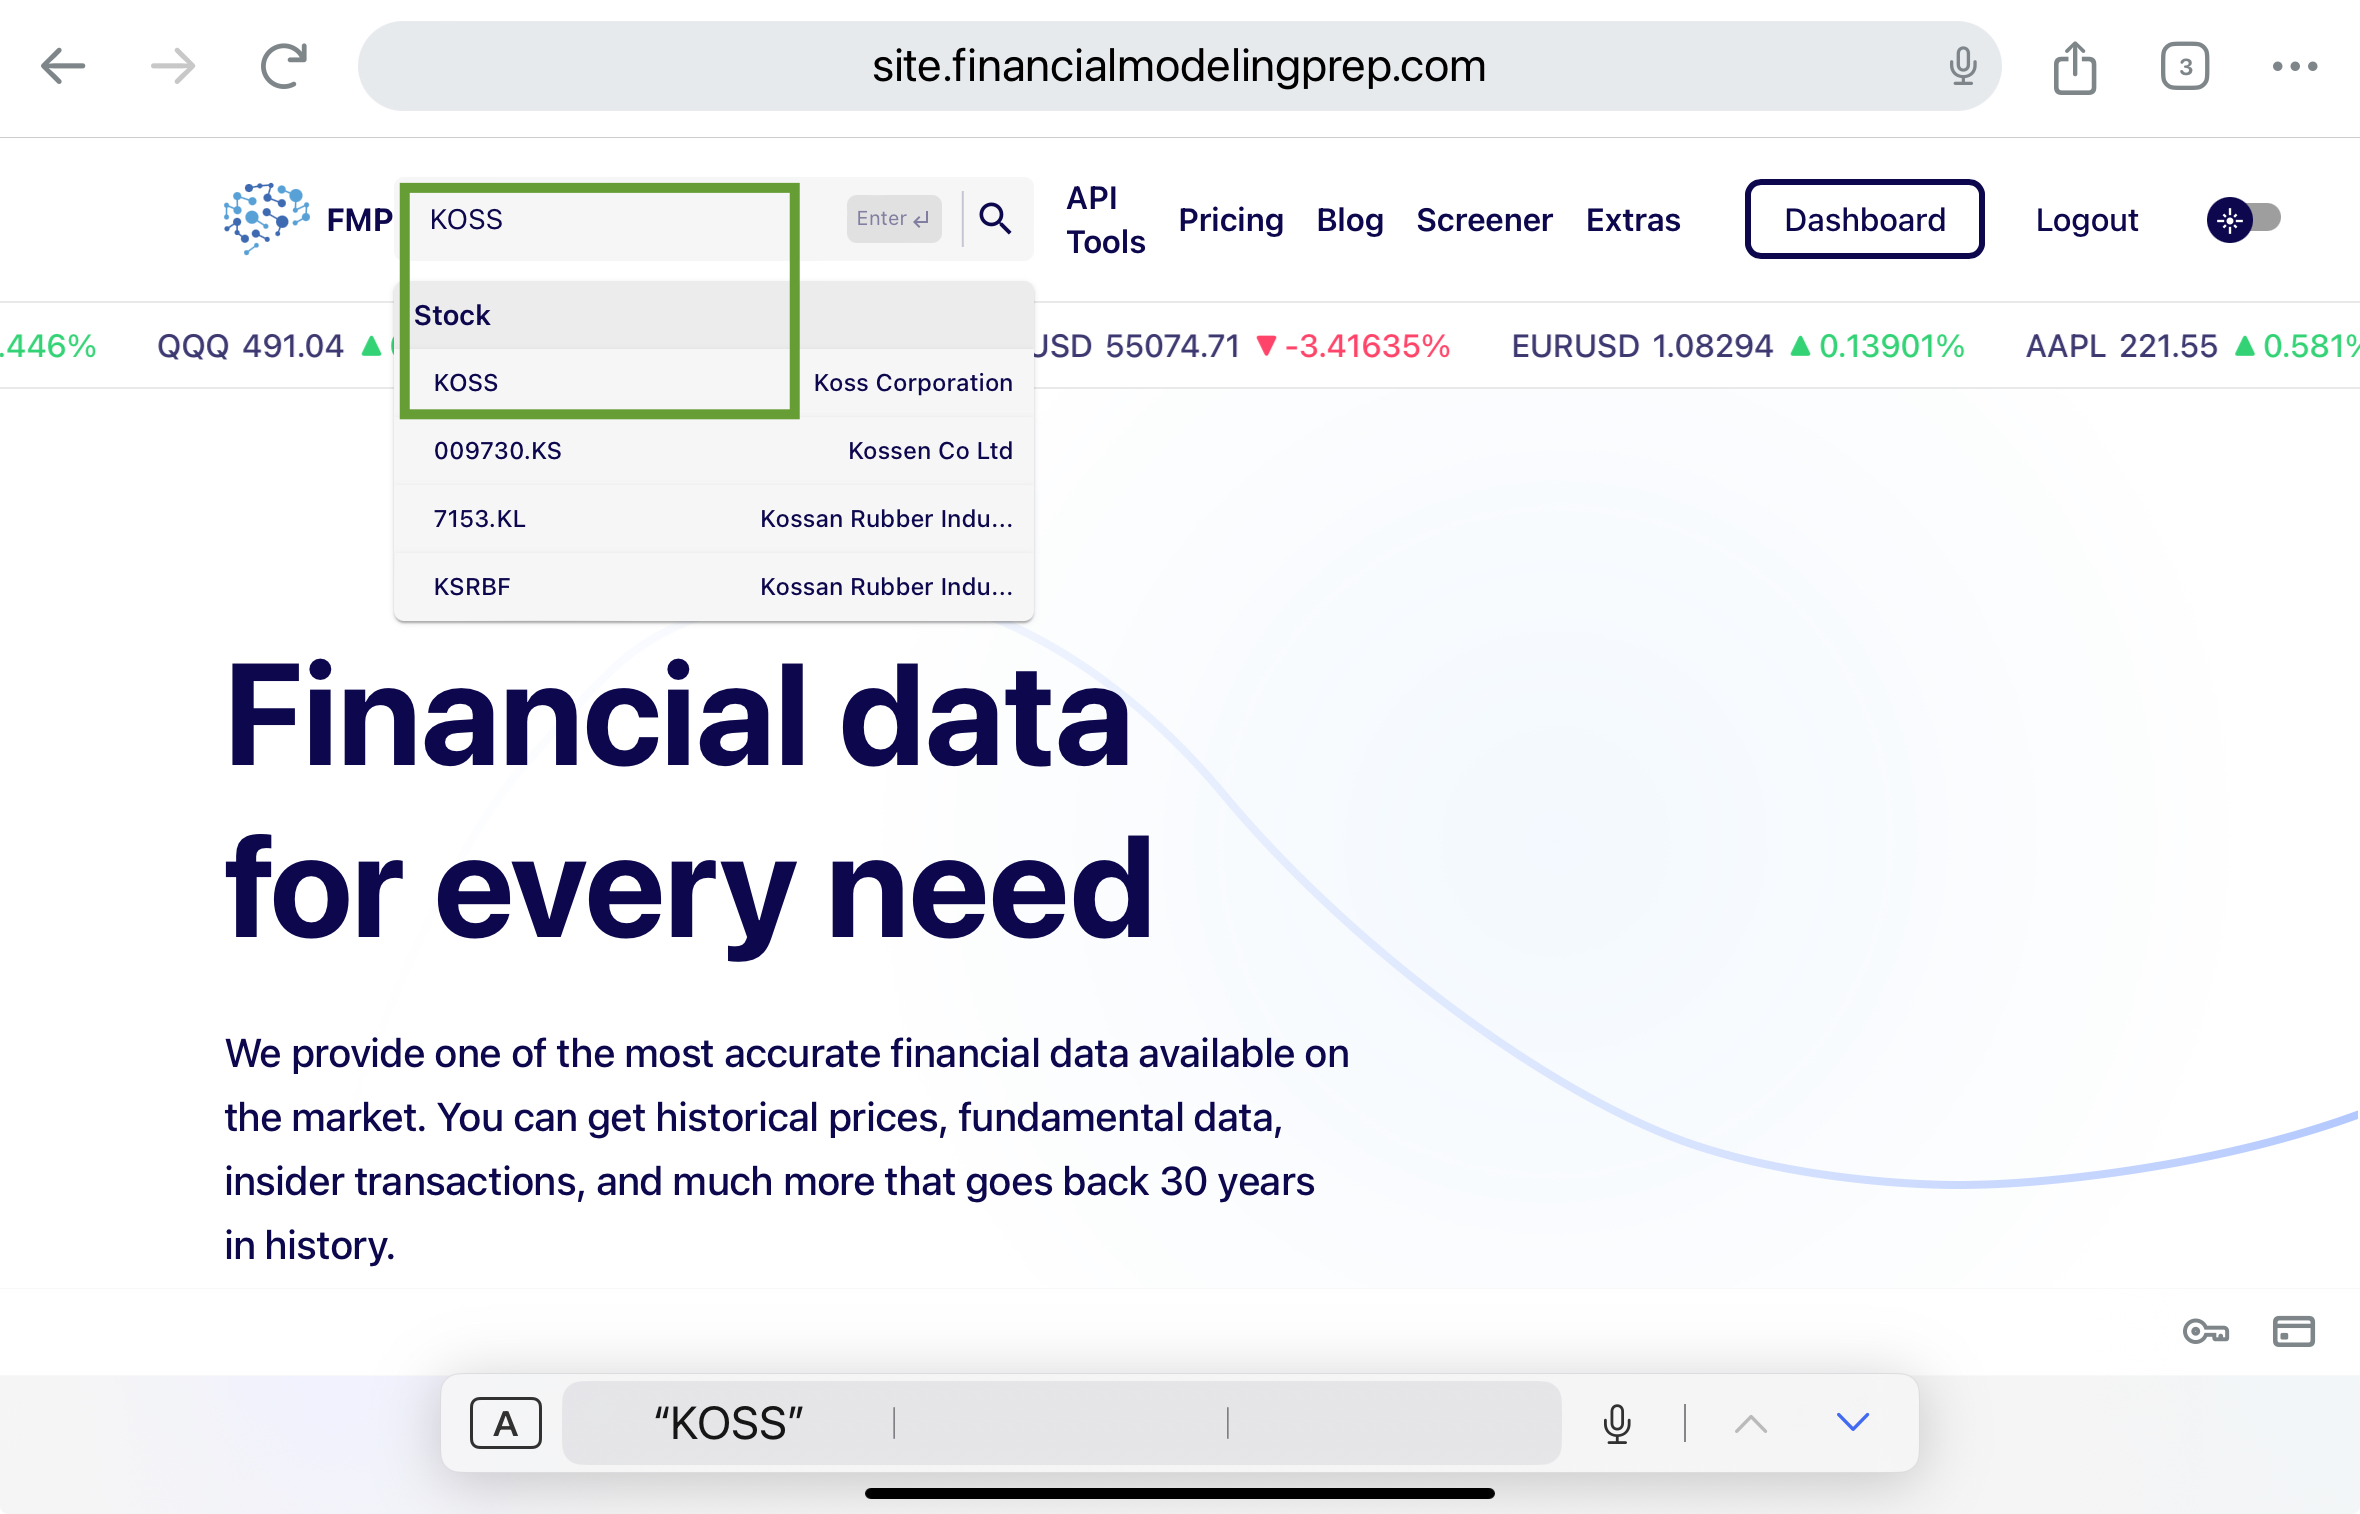
Now open financial modeling prep main page and input the stock ticker as shown in the example then press on the stock ticker, the field highlighted green. In our example, we have chosen KOSS shares. After you clicked on the stock ticker in the search bar, a new window will open with the company's fundamentals.
Scroll down the newly opened page until you see the stock graph (from the right) as shown in the picture below. Choose Candle chart and 3 month period as highlighted in the picture.
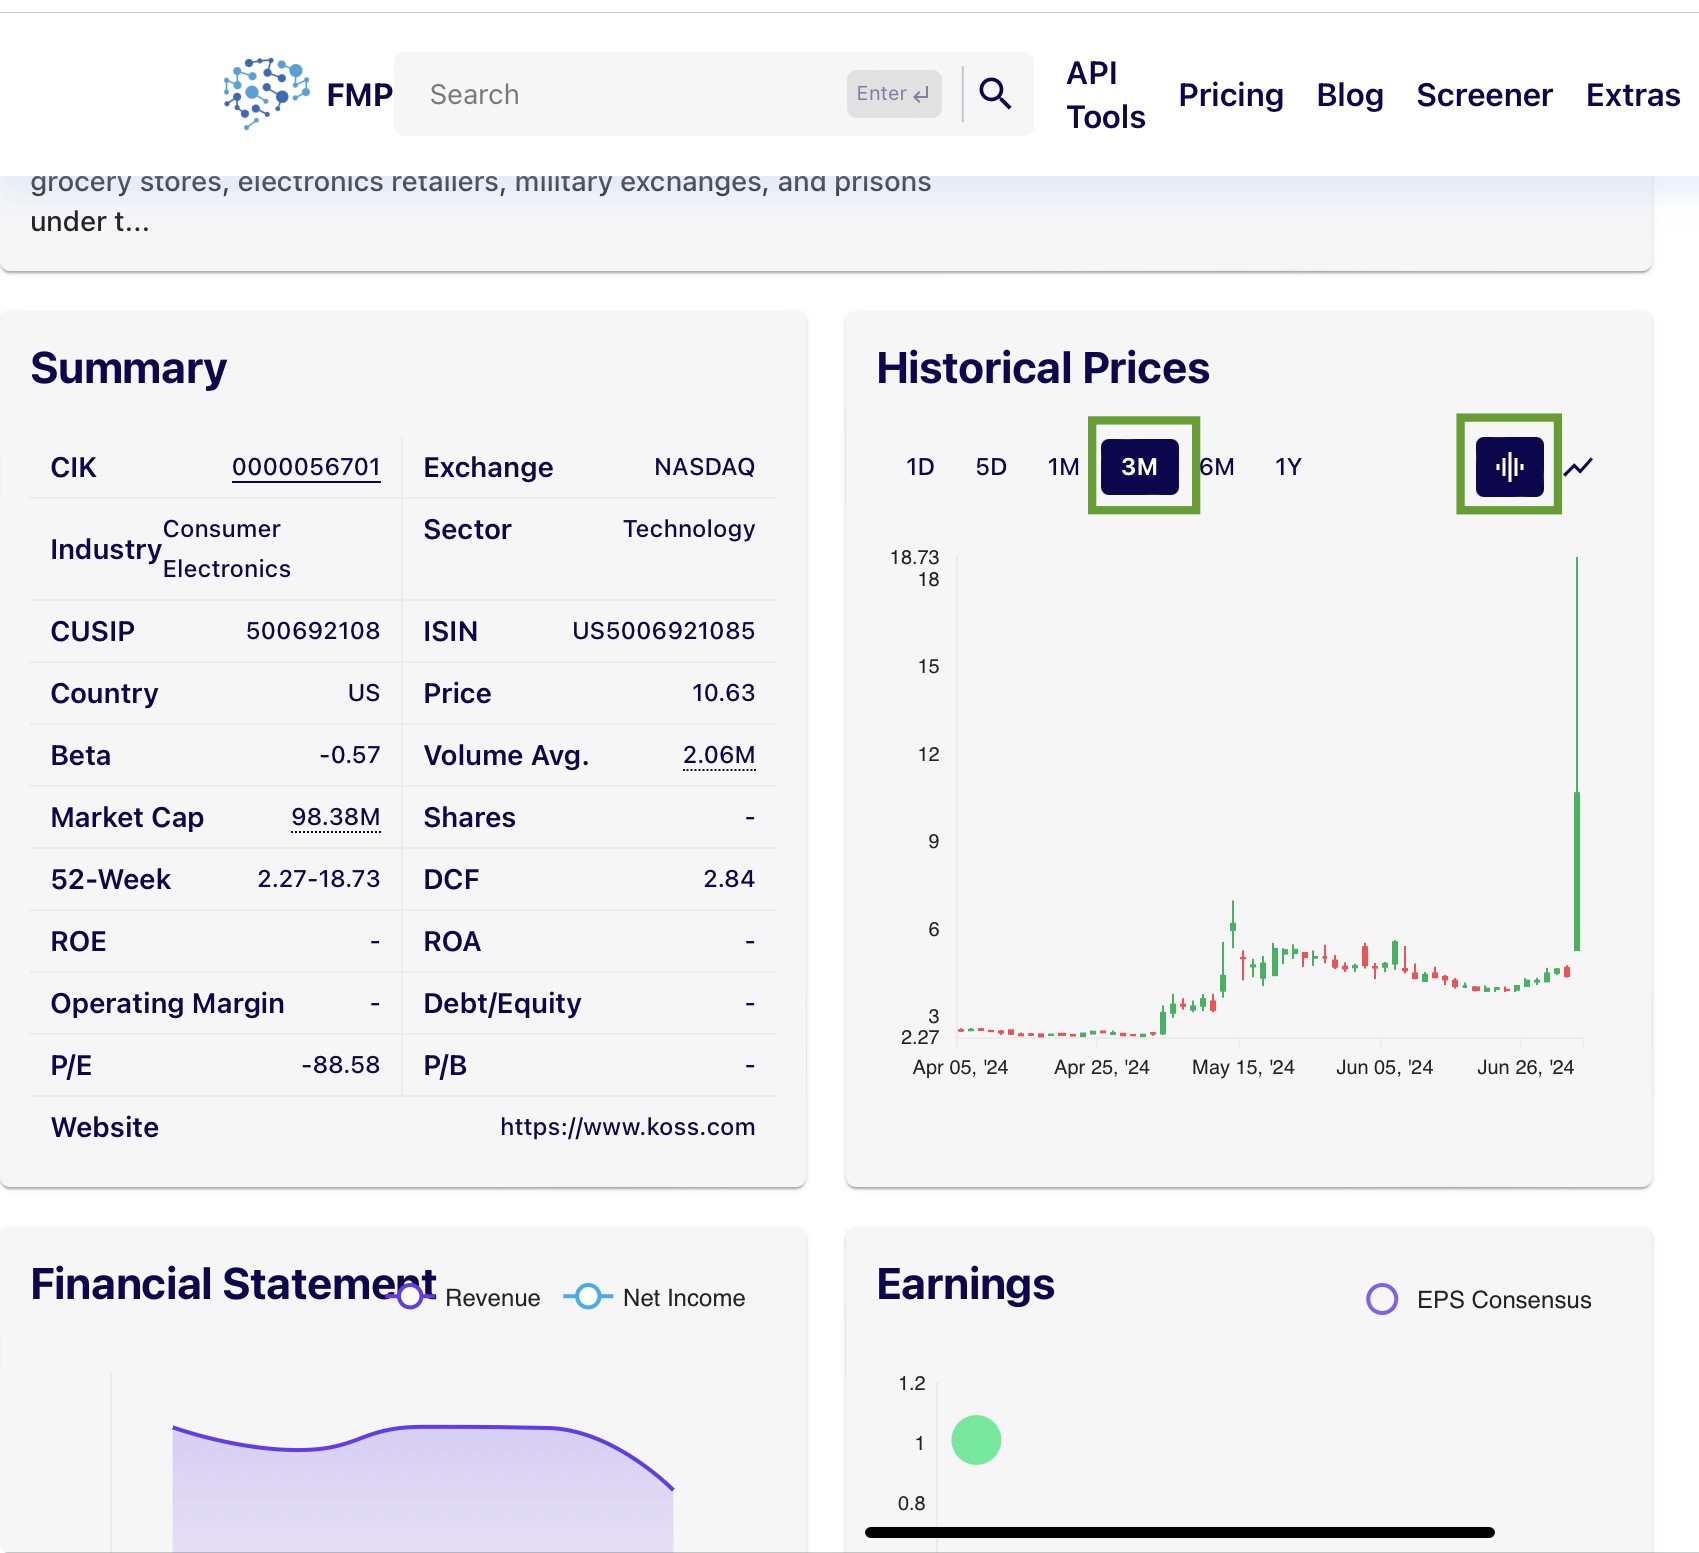
The graph above is shown in candles, where each candle represents one trading day. Choose the stock that has large candles often, by doing this, you will make sure you are picking a very volatile stock that has a wide trading range. This stock can be ideal for intraday. In our example, KOSS shares do not have large candles often; we only saw one large candle, which means that the probability that this aggressive move will repeat is very low. The next thing to look at is the company's earnings (located below the graph), actual EPS data compared to analysts' forecasts. If the company is constantly posting earnings that are better than analysts' estimations, this is a good sign, which means that there is a high probability that the company's shares will be moving upwards each time the new report comes. In the case of KOSS, its EPS results are not impressive, which means that it is difficult to say what would be the stock's move when the company releases its financial data. If you scroll slightly below the earnings graph, you will see another very useful table named "People also watch." These are the stocks that are similar to KOSS or stocks that have high interest among traders who were buying KOSS shares recently. There might be some probability that people will also be buying these shares, causing a price upside move. Examine those stocks the same way we do with KOSS shares until you find the best stock. Stock that looks great both technically and fundamentally.
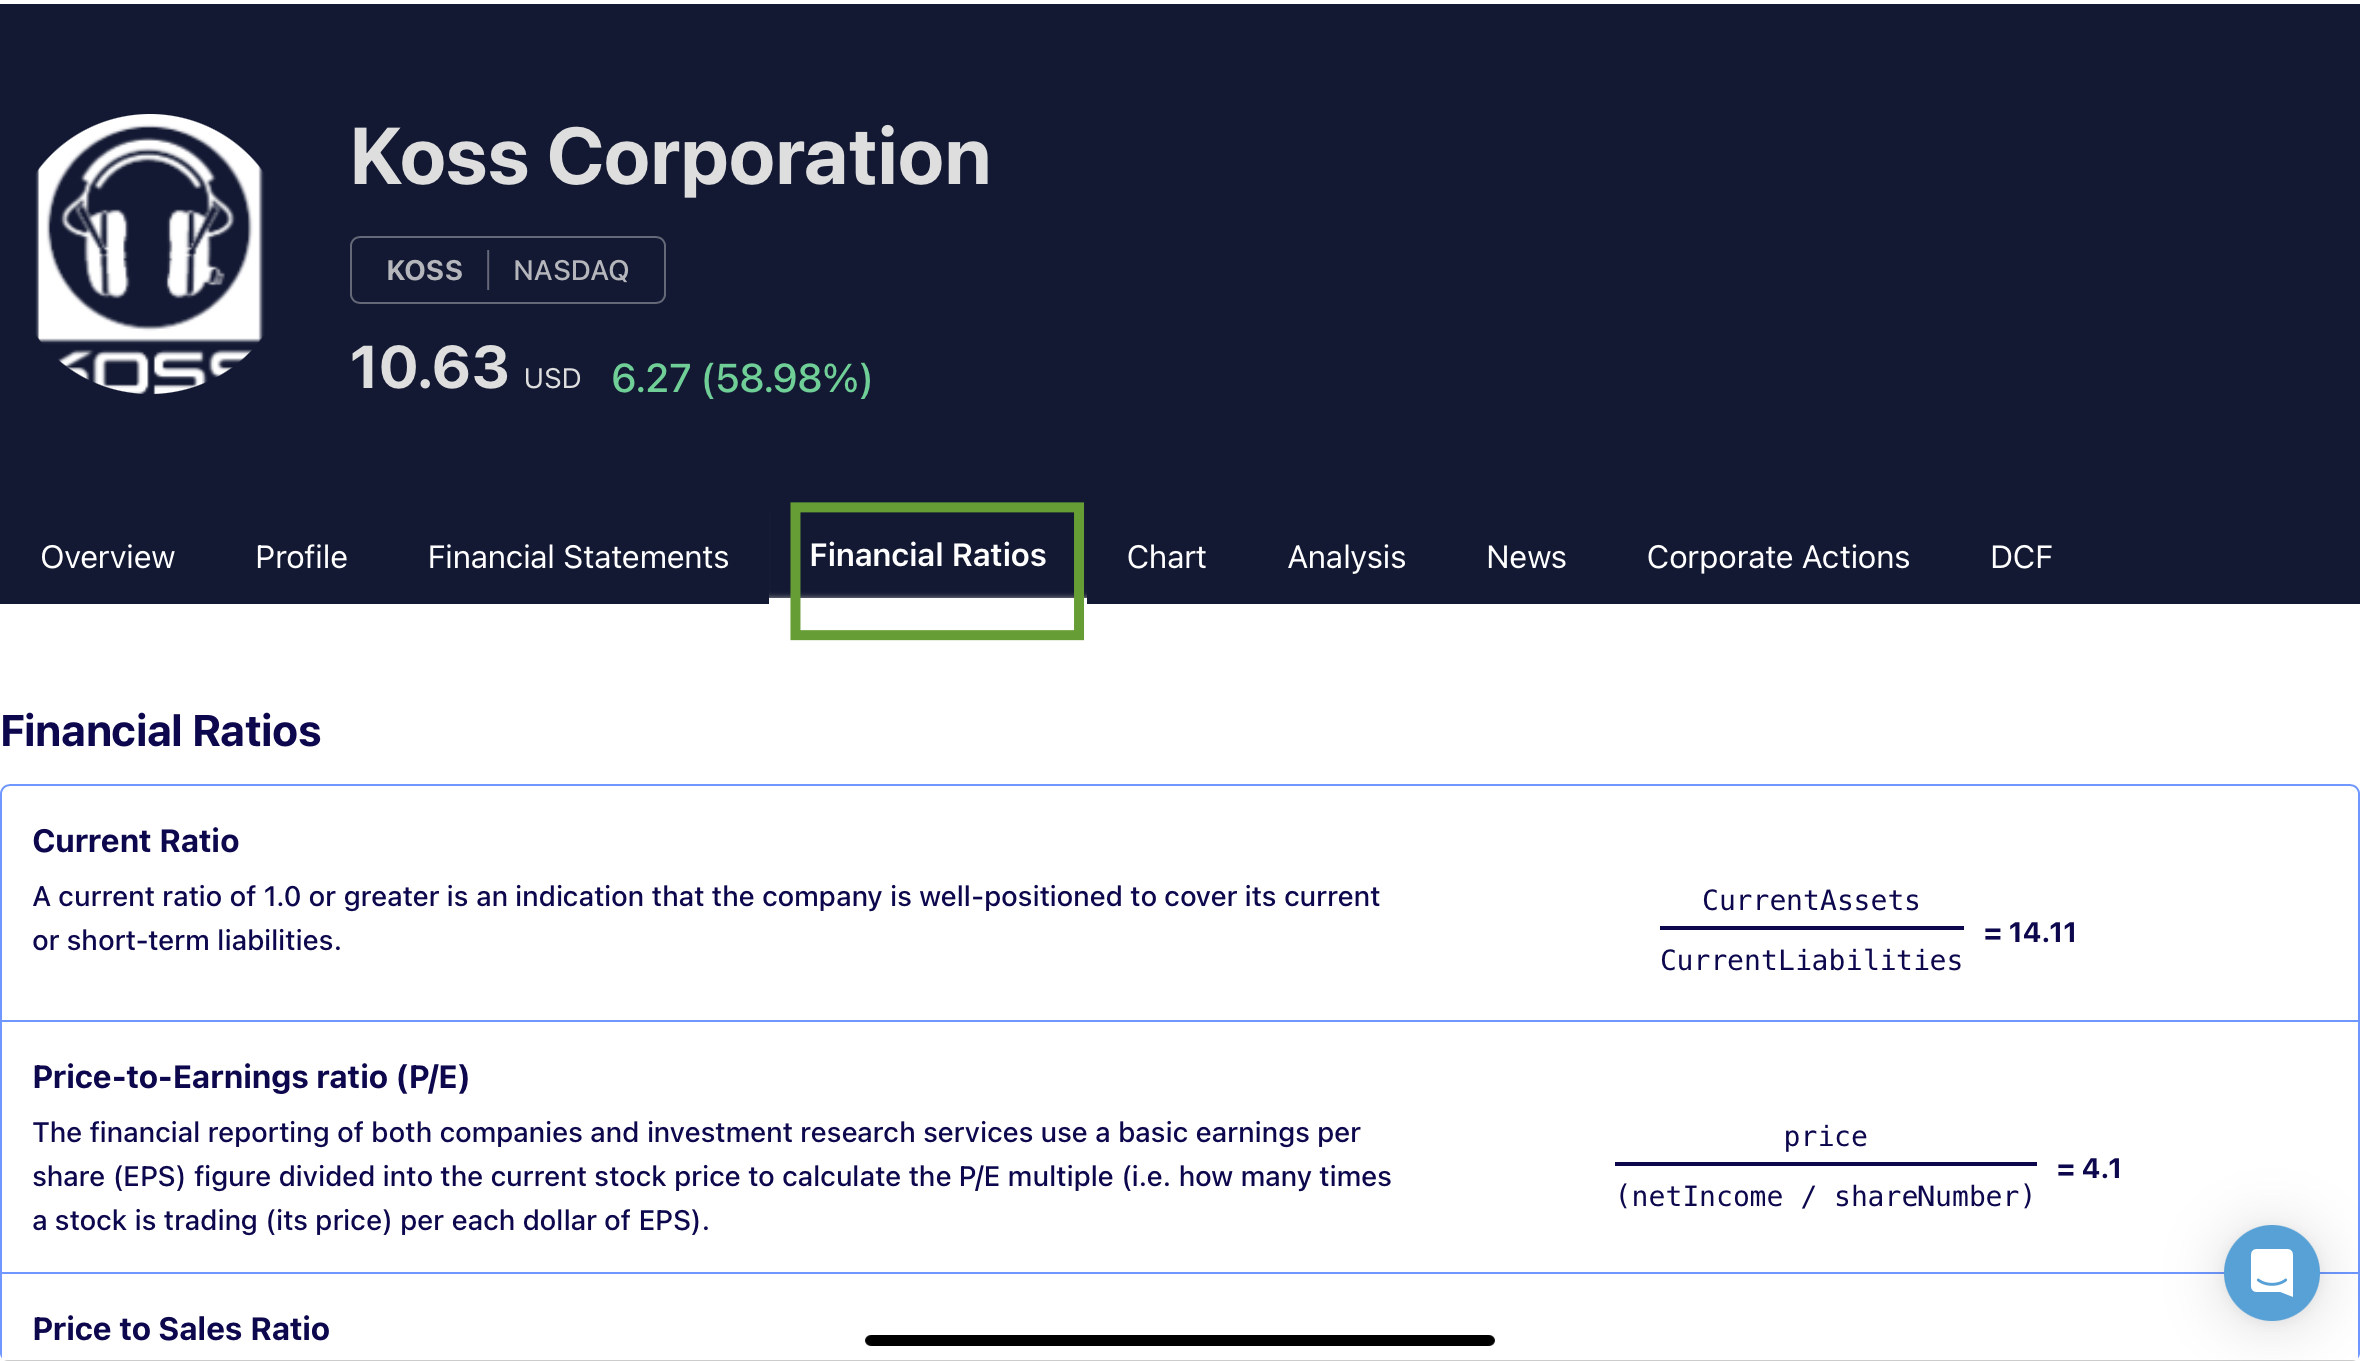
You can also look into the financial ratios tab as shown in the picture below. I have already explained how to calculate stock fair value using financial ratios and companies' closest peers. We are not doing it here now. What you can do is to take a couple of important ratios and compare your selected stocks' ratios to company's closest peers to find the most attractive stock from the financial ratios standpoint.
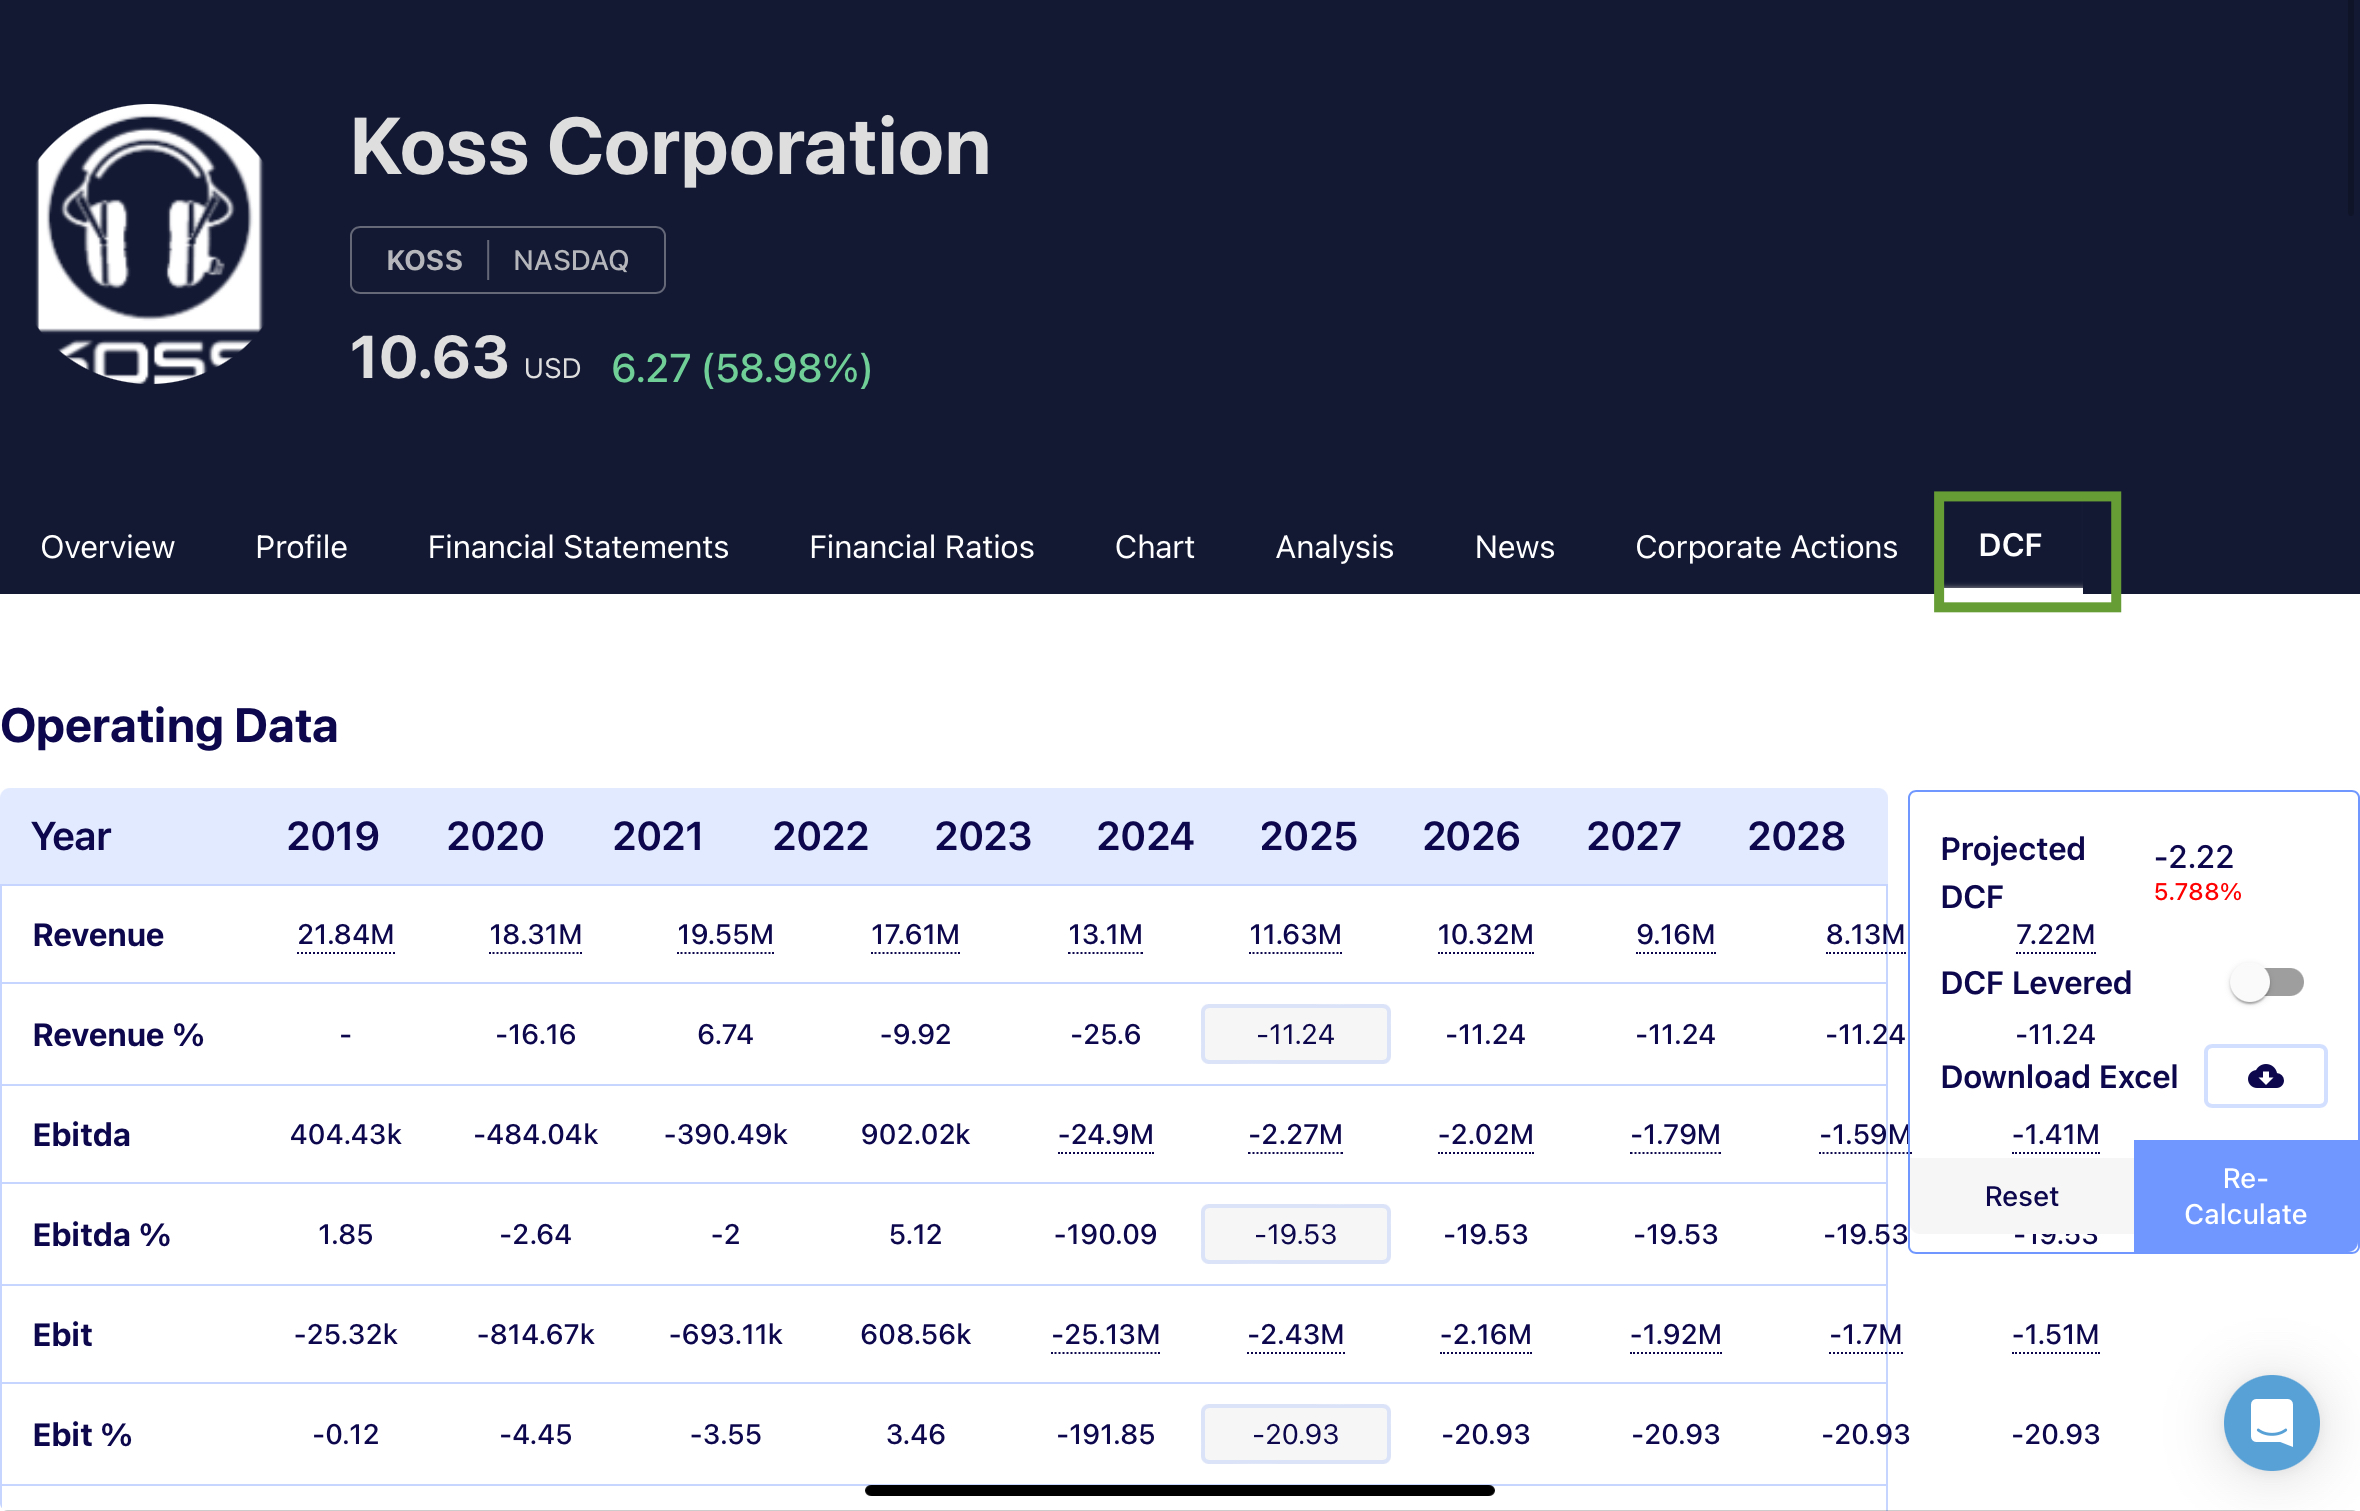
The next step would be to open the DCF tab to see what is the stock's projected target price. I have already explained how to calculate stock target price using the DCF valuation model. You can read my article to learn what are the components of the model and how to calculate stock fair value if you are interested in the technical part. But we don't need to undertake manual calculations now. If you look slightly below the newly opened screen, you will see the Projected DCF number, which is equal to -2.22 for KOSS shares. That means that currently, the stock is overvalued or trading expensive as its market price is above the stock's target price. And we can expect stock downside, if hype around these shares will decline. Of course, the stock price cannot be a negative number, but the stock target price can sometimes be negative; it happens because the company constantly shows negative cash flow or because the discount rate or WACC is too high. You can also change the parameters in the model by changing the numbers in the newly opened tab. For example, if management expects the company's revenue to increase, you can change the revenue growth number. You can also change other vital things like the tax rate or beta and input your own custom assumptions to make the DCF model comply with your own expectations and renewed data.
Important findings.
As you can see from the provided example, KOSS is not the best share to buy. Ideally, you should look for companies that constantly show better EPS (large EPS surprise), with a target price at least 20% larger than the current market price, and also have higher stock volatility without gaps or broken volumes. By doing this, you will ensure that you have a stock that is great both for shorter-term and longer-term trading. And if you buy the stock based on this method, it can decline, but there is a higher chance that it will rebound fast because it has great growth potential. But as you can see from the KOSS example, it is not the best share to buy. Now your job as a trader or investment analyst would be to spend time searching for stocks that match criteria that I described in this paragraph. I hope my explanations were clear, and now you can use this very valuable tool that will help you find great investment ideas quickly.
Other Blogs
Nov 22, 2024 5:08 AM - Parth Sanghvi
Fundamental Analysis: Principles, Types, and How to Use It
Fundamental analysis is one of the most essential tools for investors and analysts alike, helping them assess the intrinsic value of a stock, company, or even an entire market. It focuses on the financial health and economic position of a company, often using key data such as earnings, expenses, ass...

Dec 17, 2024 8:58 AM - Sanzhi Kobzhan
Examining Tesla’s Financial Health Using FinancialModelingPrep’s Ratios API
Tesla, one of the world’s most talked-about electric vehicle manufacturers, attracts a lot of attention from investors and market watchers. By examining a snapshot of Tesla’s financial ratios—such as those provided by FinancialModelingPrep’s Ratios API—we can get a clearer picture of the company’s f...

Dec 22, 2024 7:59 AM - Sanzhi Kobzhan
Two great Software Platform Stocks Similar to Palantir (PLTR)
When it comes to cutting-edge software and data analytics, Palantir Technologies (NYSE: PLTR) is often front and center. But for many investors, it’s important to consider alternative or complementary stocks in the same sector that may offer robust growth potential. As PLTR looks expensive (overvalu...
