FMP
How to define the strength of the trend with Exponential Moving Average (EMA)
Oct 10, 2024
The Exponential Moving Average (EMA) is a widely used indicator in Technical Analysis, designed to help smooth out price data and identify trends by placing greater weight on recent prices. This makes it particularly valuable in fast-moving markets, as it quickly responds to price changes while minimizing noise. EMA can help define the strength of the trend and help traders buy stocks at the right time. In this article, we'll dive into what EMA is, how it's calculated, how to use it to define the strength of the trend and how to use the Financial Modeling Prep (FMP) API to access EMA data for any stock in real time.
What is the Exponential Moving Average (EMA)?
The Exponential Moving Average (EMA) is a type of moving average that gives more weight to recent prices than older prices. This feature makes the EMA more sensitive to current price changes, which can help traders spot trends earlier and make timely trading decisions. EMA represents the line on the graph that goes close to the stock market price.
Use example:
- If the price of a stock is consistently above its EMA, it might signal an upward trend.
- If the price is below the EMA, it could indicate a downward trend.
- When the stock price crosses EMA upward this may signal that the upward trend is starting.
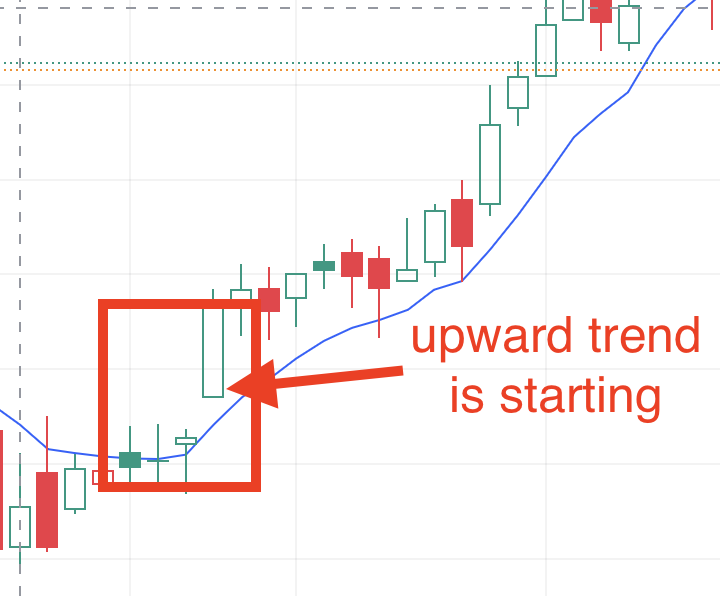
This quick reaction to new prices is what sets EMA apart from other averages, like the Simple Moving Average (SMA), which treats all prices equally over the chosen period.
How EMA Helps Stock Traders
EMA is useful for both short-term and long-term traders:
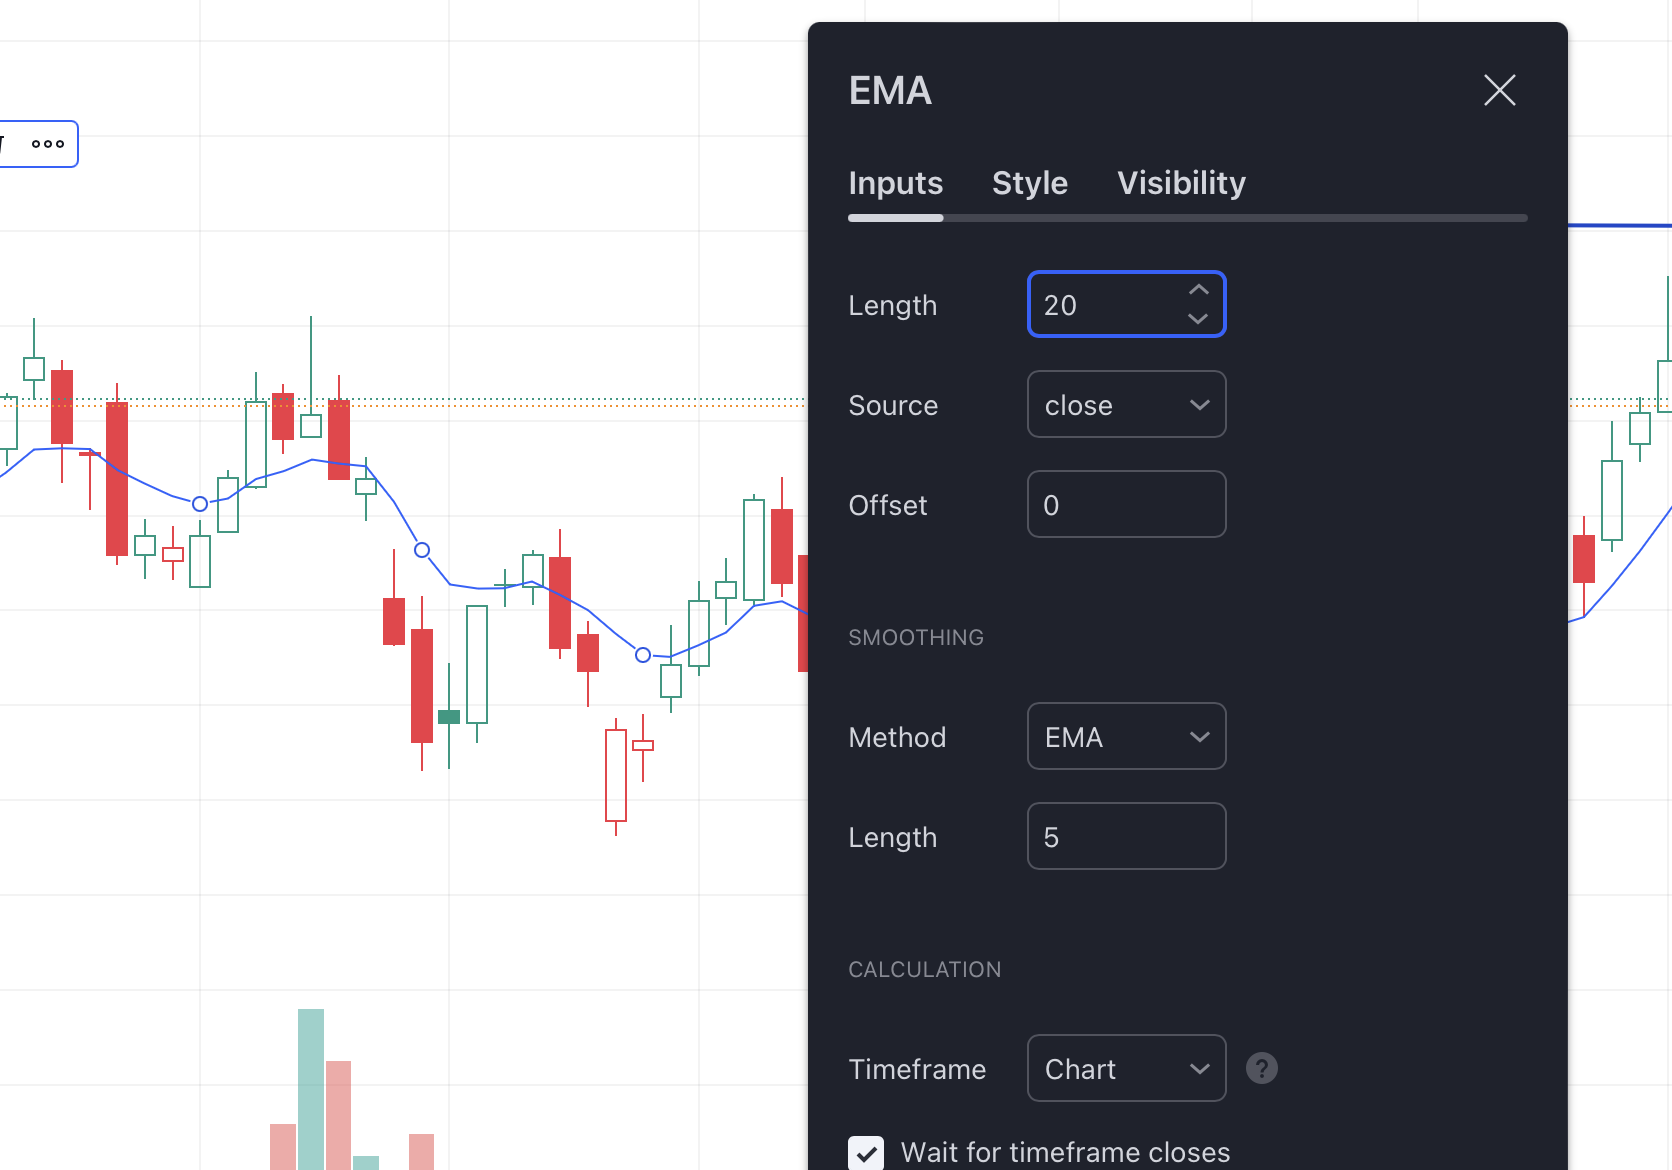
- For Short-Term Traders: A shorter EMA period (like 10 or 20 days) closely tracks recent prices, making it a good indicator for quick trades based on short-term trends.
- For Long-Term Investors: A longer EMA period (like 50 or 200 days) smooths out daily fluctuations, which helps reveal the overall trend direction and long-term opportunities.
EMA can also act as a “support” or “resistance” level:
- If a stock's price is falling towards the EMA and then bounces back up, the EMA acts as a support level.
- If a price rises to the EMA and then drops back down, the EMA acts as a resistance level.
This behavior helps traders decide when to buy or sell. For example, if the price bounces off the EMA, it might be a good buying opportunity. If it drops after reaching the EMA, it might be a sign to sell or hold off on buying.
How to Calculate EMA
Let's go through the calculation of the EMA step by step. While software and online calculators can quickly provide the EMA, understanding the formula helps you see why it's useful.
Step 1: Start with the Simple Moving Average (SMA)
To get started, calculate the SMA for the chosen period. For example, if you're using a 10-day EMA, add up the closing prices for the past 10 days and divide by 10. This gives you the average closing price over that period.
Step 2: Calculate the EMA Multiplier
Next, calculate the multiplier, which gives more weight to recent prices. This is based on the period you're using for the EMA. The formula for the multiplier is:
Multiplier = 2 / (Period + 1)
For a 10-day EMA, the multiplier would be:
2 / (10 + 1) = 0.1818
This multiplier will weight each day's closing price in the EMA calculation.
Step 3: Calculate the EMA Using the Multiplier
After getting the SMA and the multiplier, you can calculate the EMA. Here's the formula:
EMA = ( Close Price − Previous EMA ) × Multiplier + Previous EMA
This formula updates the EMA by combining the previous EMA with today's closing price. The multiplier makes sure that more recent prices have a stronger effect on the EMA than older ones.
Example: Calculating a 10-Day EMA
Let's say you have the following 10 closing prices for a stock:
Day 1: $25.00, Day 2: $26.00, Day 3: $27.00, Day 4: $26.50, Day 5: $27.50, Day 6: $28.00, Day 7: $29.00, Day 8: $29.50, Day 9: $30.00, Day 10: $31.00
Calculate the SMA (for the first 10 days, which will serve as the initial EMA):
- SMA = (25 + 26 + 27 + 26.5 + 27.5 + 28 + 29 + 29.5 + 30 + 31) / 10 = 27.65
Calculate the Multiplier for a 10-day EMA:
- Multiplier = 2 / (10 + 1) =0.1818
Calculate the EMA for Day 11 (assuming the closing price on Day 11 is $32.00):
- EMA11 =(32 − 27.65) × 0.1818 + 27.65
- EMA11 =(4.35) × 0.1818 + 27.65
- EMA11= 0.79 + 27.65 = 28.44
Calculate the EMA for Day 12 (if the closing price on Day 12 is $33.00):
- EMA12 = (33−28.44) × 0.1818 + 28.44
- EMA12 = (4.56) × 0.1818 + 28.44
- EMA12 = 0.83 + 28.44 = 29.27
The EMA now reflects recent price changes with heavier weighting and would continue to update as each new closing price becomes available. This step-by-step adjustment highlights how the EMA places greater emphasis on recent prices, making it responsive to changes in the stock's trend. But don't worry if those calculations seem difficult for you. You don't have to calculate everything manually. You can extract data using Financial modeling prep Exponential Moving Average API endpoint. Lets consider how you can do that.
Step-by-Step Guide to Access EMA Data with FMP API
1. Set up the API Endpoint.
To access the EMA data for Apple (AAPL) on a 5-minute interval, you'll use the Exponential Moving Average API endpoint
The endpoint looks like this:
https://financialmodelingprep.com/api/v3/technical_indicator/5min/AAPL?type=ema&period=10&apikey="your custom API key”
Replace “your custom API key” with your unique API key from FMP. For that you will need to register with FMP and obtain your key.
2. Define Parameters in the API URL
- type=ema: This parameter specifies that we are requesting Exponential Moving Average data.
- period=10: Defines the period of the EMA calculation, in this case, a 10-period EMA.
- 5min: Data interval, here set to every 5 minutes.
- AAPL: is the stock ticker, replace with your desired ticker.
3. Make the API Call
Once the URL is configured with your API key, you can enter it into your browser or send a request using any HTTP client ( like
Postman for example). And you can also use this endpoint for building your custom stock analysis app. But if you simply want to see the data you can run it in your browser and get the below response.
The API returns a JSON array with the latest EMA values for each interval. Here is a sample response:
[
{
"date": "2024-10-09 15:55:00",
"open": 229.57,
"high": 229.75,
"low": 229.44,
"close": 229.49,
"volume": 1332751,
"ema": 229.39818494063962
},
...
]
Each object in the JSON array includes:
- Date: Timestamp for the price data.
- Open, High, Low, Close: Price data points.
- Volume: Volume traded during that interval.
- EMA: The calculated Exponential Moving Average for the specified period (in this case, a 10-period EMA).
If you want to build your custom app and get data using JavaScript, or you can export your findings into excel using Playground. Here is how you can extract data.
Extract data with JavaScript.
1. Define API parameters
const apiKey = “your custom API key”;
const symbol = “AAPL”;
const interval = “5min”;
const period = 10;
2. Construct API URL
const url = “https://financialmodelingprep.com/api/v3/technical_indicator/${interval}/${symbol}?type=ema&period=${period}&apikey=${apiKey}";
3. Fetch EMA data from the API
fetch(url)
.then(response => response.json()) .then(data => {
data.forEach(entry => {
console.log(`Date: ${entry.date}, EMA: ${entry.ema}`);
});
})
.catch(error => console.error('Error fetching EMA data:', error));
Extract data with Financial Modeling Prep Playground.
1. Go to FMP Playground
2. Choose indicators.
In the left side bar, choose The Technical Indicators field, then click on the Exponential Moving Average
3. Input data.
Choose stock Tiker, type, period.
4. Export data.
You can find the Export button at the top right corner. Click on it to export in different formats like JSON, CSV or Text.
Example of Using EMA Data in Trading Analysis
Let's say you're analyzing AAPL using this data:
- If the closing price is consistently above the EMA, it may signal a continuing upward trend.
- Conversely, a closing price below the EMA may indicate a downtrend.
- The moment when the price starts crossing the EMA upwards (after staying below) may indicate the beginning of an upward trend.
- The moment when the price starts crossing the EMA downwards (after staying above) may indicate the beginning of a downward trend.
The EMA can also serve as a support/resistance level. For instance, if AAPL's price falls to the EMA but then bounces back, the EMA acts as a support level.
Understanding and applying the Exponential Moving Average can provide valuable insights into price trends and potential trading opportunities. The Financial Modeling Prep API simplifies accessing this data, making it easy to integrate into your trading tools. Try experimenting with different time intervals and periods to find the EMA settings that best align with your trading strategy.

MicroStrategy Incorporated (NASDAQ:MSTR) Earnings Preview and Bitcoin Investment Strategy
MicroStrategy Incorporated (NASDAQ:MSTR) is a prominent business intelligence company known for its software solutions a...

WACC vs ROIC: Evaluating Capital Efficiency and Value Creation
Introduction In corporate finance, assessing how effectively a company utilizes its capital is crucial. Two key metri...

BofA Sees AI Capex Boom in 2025, Backs Nvidia and Broadcom
Bank of America analysts reiterated a bullish outlook on data center and artificial intelligence capital expenditures fo...

