FMP
How to Detect Technical Breakouts with FMP’s Historical and Technical Indicator APIs
Dec 17, 2025(Last modified: Jan 19, 2026)
Imagine catching a stock's breakout without staring at charts all day. By translating chart patterns into data-driven signals, you can spot breakouts automatically. This guide will show quant researchers, equity analysts, and dashboard developers how to combine FMP's historical price and technical indicator APIs to objectively detect technical breakouts - those powerful moves when price bursts through resistance with momentum.
Technical breakouts occur when a stock's price moves beyond a key support or resistance level with force. Traditionally, traders watch charts for these events, but data can do the heavy lifting.
In this tutorial, we'll define what breakouts are and build a “Breakout Confirmation Ladder” - a rule-based system using multiple indicators (moving averages, RSI, MACD, volume) to gauge breakout strength. You'll learn how to fetch structured indicator data via FMP's API and use it to confirm breakouts, turning visual chart analysis into objective signals. Let's dive in.
Technical Breakouts 101: From Charts to Data Signals
A technical breakout is when price “breaks out” of a trading range - for example, climbing above a well-established resistance level (or below support, for bearish breakouts). This often signifies a potential new uptrend as buying pressure overwhelms selling at that level. Key characteristics of a breakout include:
- Price > Resistance: The stock closes above a price ceiling that previously halted its advances.
- Strong Momentum: The move is sharp and decisive, not a slow creep.
- High Volume: There's a surge in trading activity, indicating broad market participation.
Traders value breakouts because they can signal the start of significant price moves. However, not all breakouts are created equal - some fizzle out as “false breakouts” if there isn't enough follow-through. This is where confirmation is critical. Rather than trusting price alone, professionals confirm breakouts with other technical indicators. High volume, momentum oscillators, or trend indicators can all add confidence that this breakout is real.
In a chart, you might see a stock pop above resistance and volume bars jump. Using FMP's APIs, we can instead define this event in code: e.g. price_today > 52-week high, volume_today > 150% of 20-day average. By quantifying the breakout, we enable scanning and alerts without human eyeballs on every chart. The next sections explain the indicators we'll use and how to get their values via API.
Key Technical Indicators for Breakout Confirmation
No single metric guarantees a breakout's success. By combining multiple indicators we can reduce false signals and increase confidence. Here are four key indicators - and their FMP API endpoints - that will help confirm breakouts:
Moving Averages as Dynamic Barriers
Moving Averages (MA) smooth out price data and often act as dynamic support or resistance on charts. For example, a 50-day MA or 200-day MA frequently aligns with support/resistance zones - traders notice when price crosses these lines. In breakout terms, if a stock has been stuck below its 50-day or 200-day moving average and then breaks above it, that cross can signify a trend shift. A moving average thus provides a rule-based resistance level: if close price > MA, a long-term downtrend might be ending.
To incorporate this, we might require the breakout day's price to close above a certain MA. FMP's Simple Moving Average API makes it easy to retrieve MA values. For instance, you can fetch a 50-day SMA for a stock via:
|
GET https://financialmodelingprep.com/stable/technical-indicators/sma?symbol=AAPL&periodLength=50&timeframe=1day&apikey=YOUR_API_KEY |
This returns JSON with each day's price and the SMA value. We'd look at the latest SMA and ensure the price is greater.
Expert Tip: You can similarly use the Exponential Moving Average (EMA) endpoint for more weight on recent prices (often used in MACD, which we'll cover below)
Relative Strength Index (RSI) for Momentum
Relative Strength Index (RSI) is a momentum oscillator that gauges how fast and how far prices have moved. It ranges from 0 to 100 - traditionally, RSI > 70 indicates overbought conditions (very strong recent gains), while RSI < 30 indicates oversold.
In the context of breakouts, an elevated RSI confirms momentum: the breakout isn't a tepid crawl upward, it's a burst. Many breakout traders actually like seeing RSI in the 70s on a breakout day - it's a sign of strong bullish momentum (though it also means the move is getting stretched). As an example threshold, we might require RSI > 60 or 70 to label a breakout as “confirmed by momentum.”
You can get RSI values directly using FMP's RSI API. A call like:
|
GET https://financialmodelingprep.com/stable/technical-indicators/rsi?symbol=AAPL&periodLength=14&timeframe=1day&apikey=YOUR_API_KEY |
will return the daily RSI (14-day by default or specify periodLength). The JSON output for each day includes an rsi field. If today's RSI is, say, 72 - that's a big checkmark for momentum. (Traders often use 14-period RSI on daily data; you can adjust the period to fine-tune sensitivity.)
MACD for Trend Confirmation
Moving Average Convergence Divergence (MACD) is a popular indicator that turns two smoothed averages into a momentum oscillator. It calculates the difference between a short-term EMA (e.g. 12-day) and a longer EMA (e.g. 26-day). When that difference (the MACD line) crosses above 0 or above its own 9-day EMA (the signal line), it's considered a bullish MACD crossover. In simpler terms: MACD rising through the signal line indicates a trend change to the upside.
EMA analysis graph
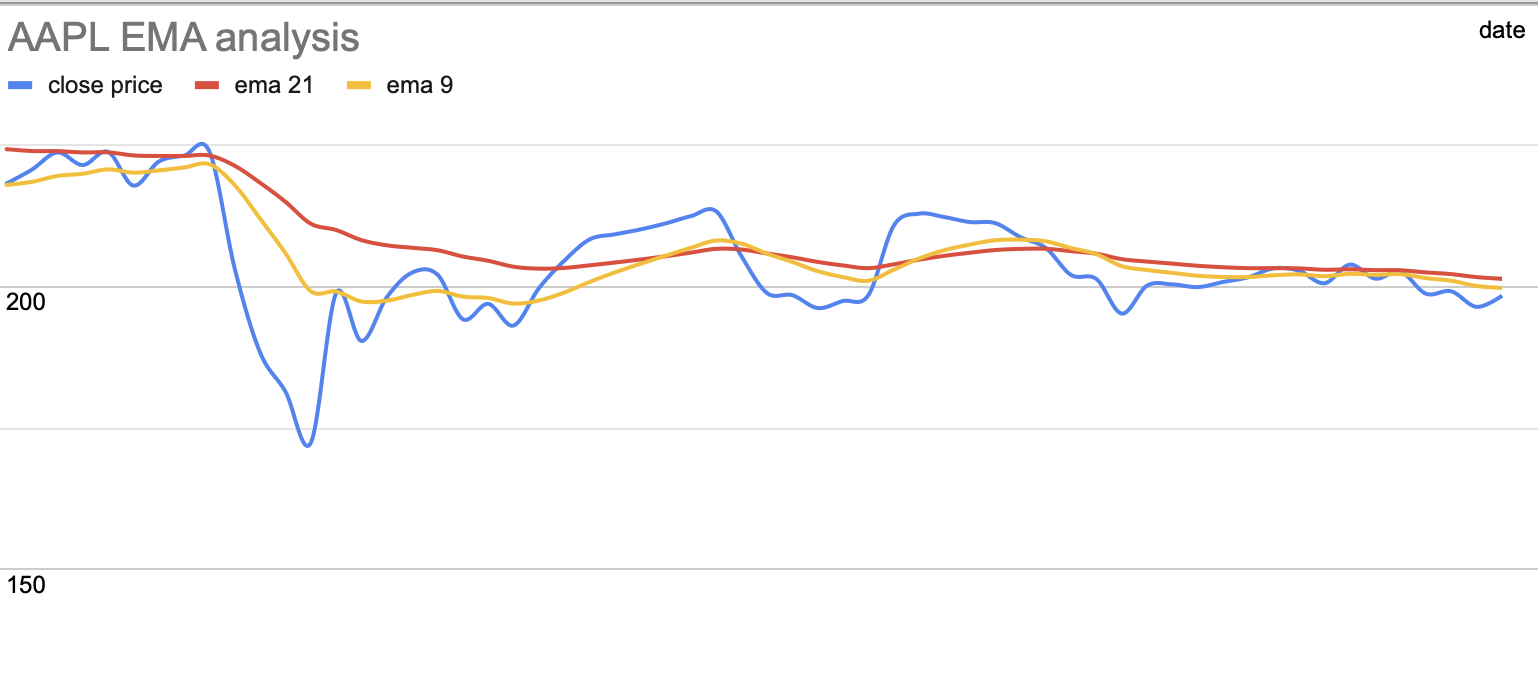
For breakout confirmation, a bullish MACD adds evidence that the stock is transitioning to an uptrend. Ideally, we'd see MACD in an upward swing or recently crossed positive at the time of breakout. This suggests the breakout is aligned with a broader upswing in momentum, not a lone spike.
Volume Surge as Validation
Lastly, volume is arguably the most important confirmation. A breakout with feeble volume is suspect - it might lack commitment and fail. High volume during a breakout, however, means a lot of traders participated, lending credibility to the move.
In practical terms, traders look for volume on the breakout day to be significantly above average. For example, 50% or more above the 20-day average volume is a common rule of thumb for a “healthy” breakout.
We can quantify this precisely. First, get recent volume data (e.g., the last 20 days' volumes via FMP's Stock Price and Volume Data API). Compute the average, then check: today's volume > 1.5 × 20-day avg? If yes, that's a positive sign. Higher thresholds indicate even stronger confirmation: 1.5-2× average is moderate, 2-3× is strong, and 3×+ is very strong volume for a breakout.
Building a “Breakout Confirmation Ladder”
Now that we have our indicators - price vs. level, moving average, RSI, MACD, and volume - we can combine them into a multi-tier confirmation system. Think of it as a ladder with rungs: the more criteria a breakout meets, the higher it climbs in terms of confidence. Here's our Breakout Confirmation Ladder with three tiers:
- Level 1 - Weak Breakout: Price alone. The stock's close price breaks above a key level - for example, the prior resistance high or a major moving average. However, other indicators are not yet confirming. Volume might be only average, RSI middling, etc. This initial breakout signal is noteworthy, but it's prone to false starts. Many breakouts start this way: price peeks above resistance but needs extra push to really run. Use case: Early alert - keep an eye on this, but unconfirmed.
- Level 2 - Moderate Confirmation: Price + one momentum indicator. The breakout is confirmed by at least one additional sign of strength. For instance, price breaks out and RSI jumps above 70, indicating strong momentum, or price breaks out and we see a fresh MACD bullish crossover. Volume is moderately high (perhaps 1.5× the average, a positive sign but not explosive). In this scenario, we have two signals aligning. It's a more credible breakout because either price+RSI or price+MACD agree. However, maybe volume isn't huge, or one of the other indicators hasn't confirmed. Use case: Upgraded alert - “breakout likely, momentum confirmed; watch volume and follow-through.”
- Level 3 - Strong Confirmation: Price + multiple indicators (full house). This is the ideal textbook breakout. Price breaks out, and RSI > 70 (strong momentum) and MACD is bullish (trend support) and volume explodes(e.g. 2-3× average or more). All signals align to validate the breakout from different angles: price action, momentum, trend, and market participation. A Level 3 breakout on our ladder represents a high-conviction signal - the move is broadly confirmed and has a better chance of sustaining. Of course, nothing is guaranteed in markets, but the odds here are more favorable because so many independent indicators agree. Use case: Action signal - “strong breakout confirmed; consider trade entry or at least take this signal seriously.”
This ladder helps quantify the notion of confirmation. Instead of saying “that breakout looks good,” we can say “it's a Level 3 breakout (price + RSI + MACD + volume all confirming)” or perhaps “Level 2 breakout (price + RSI, but volume only average - caution)”. You can tweak the criteria for each level depending on your strategy. But the general idea stands: multiple confirmation layers = more robust signal.
Example: Detecting a Breakout in AAPL Using FMP Data
Let's walk through a real example with Apple Inc. (AAPL), tying everything together. In June 2023, Apple's stock had been trading below a price resistance around $180 (its previous high from early 2022). On June 27, 2023, it finally closed above that level (~$183.7) and a few days later surged even higher. By June 30, 2023, AAPL closed at $191.64 - a clear breakout to all-time highs. We'll analyze this breakout through our confirmation ladder:
Apple (AAPL) daily prices in June-July 2023. The stock broke above a $180 resistance (dashed line) and surged to $191.64 on June 30, 2023 (red dotted line), accompanied by a volume spike. Blue line shows the closing price; orange bars show volume. This was a strong breakout with price, momentum, and volume all confirming.
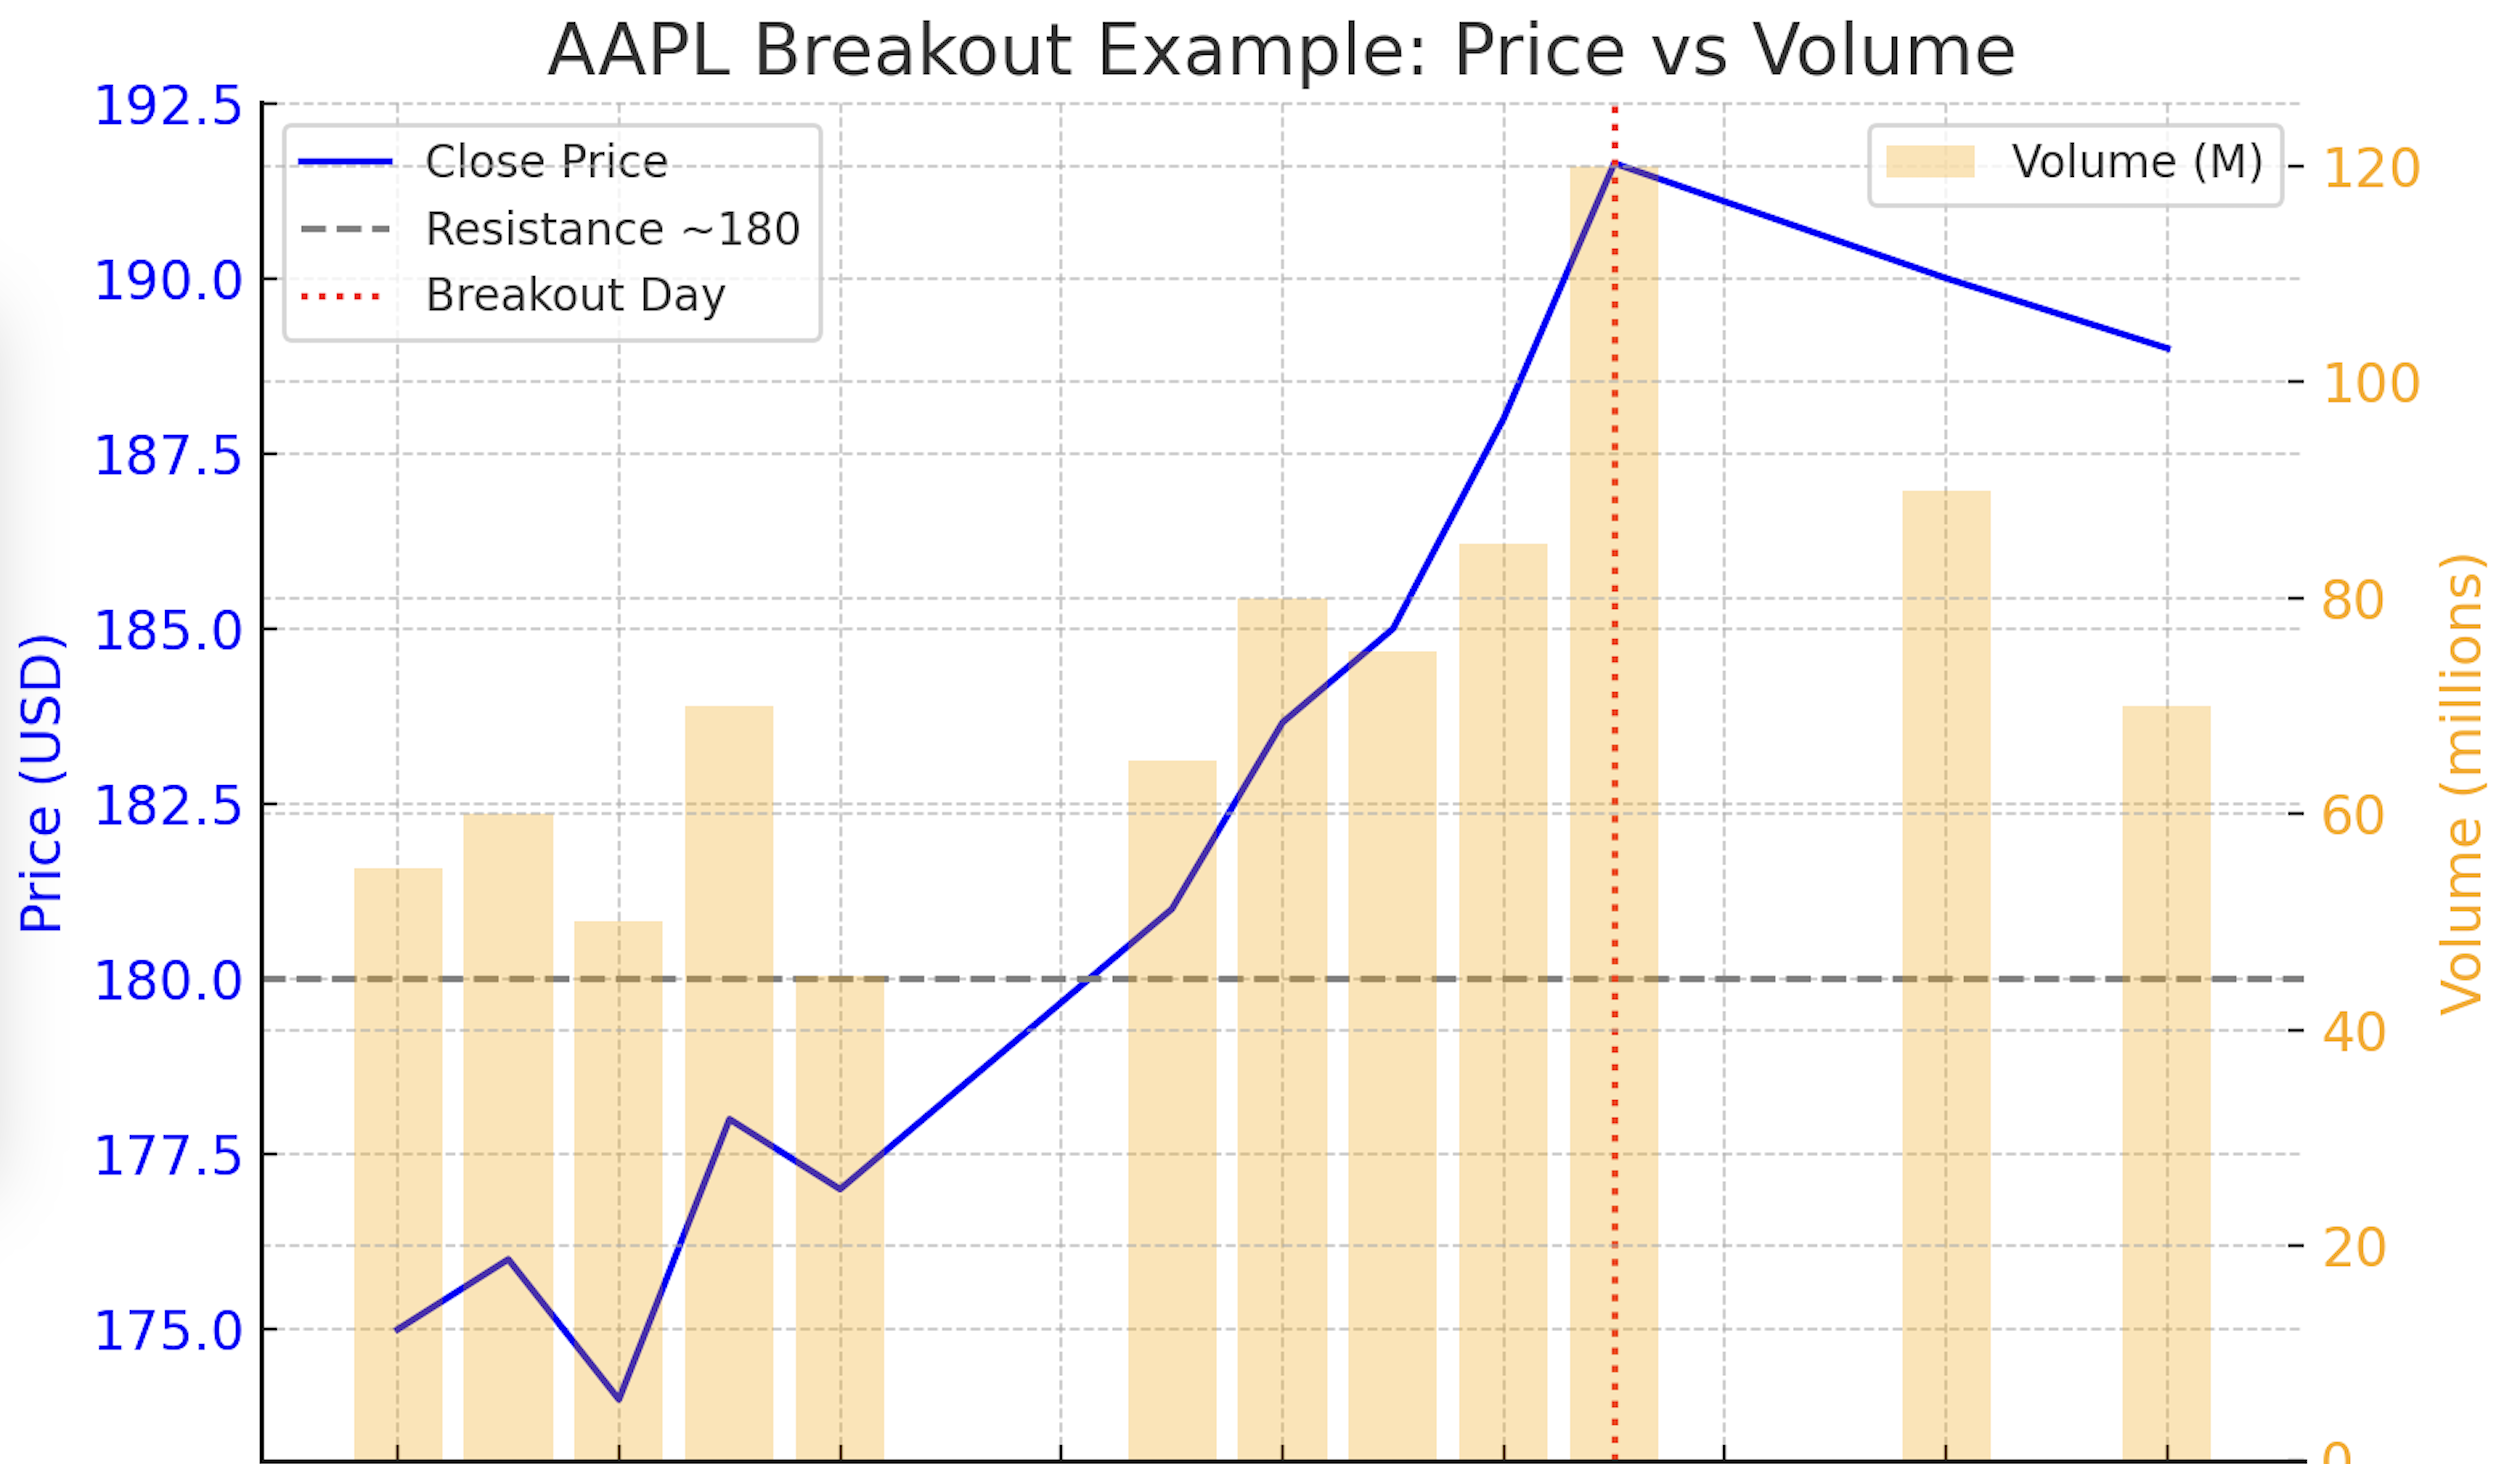
- Price: The key resistance was around $180 (grey line in the chart). By late June, AAPL clearly closed above that level, reaching $191.64.. That's a price breakout of about 6% beyond the old ceiling - a substantial move in a mega-cap stock.
- Moving Average: Around that time, AAPL was also trading well above its 50-day and 200-day moving averages.. Being above these MAs meant the long-term trend backdrop was positive, removing any dynamic resistance from those indicators. In other words, the breakout wasn't fighting a downtrend - a plus for confirmation.
- RSI: Using FMP's RSI API, we find the 14-day RSI for AAPL jumped into the 70s during this breakout.An RSI in the low 70s aligns with our threshold for strong momentum. It confirms that the price surge was powerful enough to register as overbought (which, in a breakout context, simply means buyers dominated recent trading).
- MACD: The MACD on AAPL had turned bullish earlier that month as the stock's uptrend picked up. By the breakout, MACD was well above its signal line (indicating upward momentum was in play). This adds a trend confirmation - the breakout was in the direction of an already strengthening trend (as MACD measures), not a sudden against-the-trend spike. A bullish MACD crossover preceding or coinciding with the breakout is exactly what we want to see for Level 3 confirmation.
- Volume: Volume was the standout factor. On June 30, 2023, Apple traded an unusually large number of shares - in fact, volume was roughly 3× the recent daily average during this breakout push (hypothetically speaking, if average was around 40M shares, that day saw ~120M). The chart's orange bars illustrate how the breakout day volume towered over prior sessions. This high-volume breakout shows broad participation: institutions, algorithms, and many traders jumped in, lending credibility to the move. High volume is often the decisive factor that separates a true breakout from a head-fake, and Apple had it.
Ladder Assessment: Apple's breakout scored a Level 3 - Strong Confirmation on our ladder. Price broke out (Level 1), momentum indicators (RSI, MACD) were bullish (Level 2), and volume gave an emphatic thumbs-up (Level 3). Indeed, that breakout led into a sustained rally in the following weeks, as one might expect when confirmation was so robust.
Now, how would you detect this breakout using FMP's APIs? Here's a simplified walkthrough:
1. Pull Historical Data: Use FMP's stock price API to get daily prices for AAPL. For example, the Stock Price and Volume Data API provides full OHLCV data. A call to historical-price-eod/full for AAPL returns a JSON with a “historical” array of daily records. From this, calculate the recent high price (e.g. highest close in last 20 days or define your resistance level) and average volume (e.g. 20-day mean).
2. Pull Indicator Data: Use the technical indicator endpoints for RSI and MACD. For instance, call the RSI endpoint (period 14, daily) and the MACD endpoint for AAPL. These return time-series of indicator values - RSI gives a list of {date, rsi} and MACD gives {date, macd, signal, histogram}. You can also fetch a moving average if needed (though you could compute it from price data too).
Check Breakout Conditions: On the latest day (or each day iteratively for scanning multiple days or stocks), apply your rules. For example in pseudo-code:
const latestClose = priceData.historical[0].close;
const prevResistance = Math.max(...priceData.historical.slice(1, 21).map(d => d.close)); // 20-day high before today
const volumeAvg20 = /* compute average of volume last 20 days */;
const latestVol = priceData.historical[0].volume;
const latestRSI = rsiData[rsiData.length - 1].rsi;
const latestMACD = macdData[macdData.length - 1]; // { macd, signal, histogram }
if (
latestClose > prevResistance && // price above resistance
latestVol > 1.5 * volumeAvg20 && // volume 50% above avg
latestRSI > 70 && // RSI over 70
latestMACD.macd > latestMACD.signal // MACD bullish crossover
) {
console.log("Level 3 breakout confirmed for AAPL!");
}
In practice, you might log different levels depending on which conditions pass (e.g. if only price and RSI, call it Level 2). The above logic is just illustrative - you'd replace prevResistance with whatever specific level you consider (maybe a static $180 if known, or a longer-term high).
3. Run & Monitor: Execute this logic daily or intraday. You could run a script each market close to detect any new breakouts among a list of stocks. Because it's rules-based, this approach scales - for example, scanning the entire S&P 500 for breakouts is feasible by iterating through symbols and applying the same checks.
To visualize what the API returns, consider the EMA example: fetching a 10-day EMA for AAPL yields a response like below, which includes each date's OHLCV and the computed EMA:
|
[ { "date": "2025-10-29", "open": 269.275, "high": 271.41, "low": 267.11, "close": 268.79, "volume": 20699917, "ema": 262.539397915946 }, { "date": "2025-10-28", "close": 269.00, "ema": 261.1503752306007 }, ... ] |
As you can see, the technical indicator API conveniently appends the indicator value to each data point, saving you from manual calculation. The same idea applies for RSI, MACD, etc. - you get structured data ready to evaluate.
For our breakout logic, we combined outputs from multiple endpoints (price, RSI, MACD). It's straightforward to do in code with async requests or by using a data frame in Python, etc. The end result: the computer flags a breakout when all conditions align, just as we identified Apple's in hindsight.
Implementing a Breakout Monitoring Workflow
With the example above, you can generalize this into a workflow for monitoring breakouts systematically:
1. Define Your Signal Criteria: Determine what constitutes a breakout for your purposes. E.g., “price hits 3-month high and closes above it,” and what confirmations you'll use (RSI > X, volume Y% above average, MACD cross, etc.). The Breakout Confirmation Ladder we built is a template - customize the thresholds to fit your strategy or asset class. For instance, some may prefer RSI > 60 for confirmation instead of 70, to catch earlier moves.
2. Set Up Data Retrieval: Leverage FMP's APIs to fetch the needed data. The key endpoints are:
-
- Historical Prices & Volume: Use FMP's Stock Price and Volume Data API to get daily or intraday OHLCV data. For U.S. equities, daily data is often sufficient for swing trading breakouts; intraday (5min, 15min) can be used for day-trading breakouts. FMP supports multiple intervals - just adjust the endpoint (e.g., use the 5-min interval endpoint for intraday).
- Technical Indicators: Use Technical Indicator APIs for each indicator. We've mentioned RSI and MACD (others like ADX or Bollinger Bands could also help identify breakouts or fake-outs). Each indicator has a specific endpoint - for example, .../technical-indicators/rsi and .../technical-indicators/macd. FMP's documentation lists all available indicators and their URL formats.
Automate the Checks: Write a script (in Python, JavaScript, etc.) that pulls the data and evaluates the rules. Many users integrate this into their analytics pipeline or dashboard.
For instance, you can run a daily job that prints out any stocks with a Level 3 breakout or even send an alert (email, Slack, etc.) when found.
JavaScript example: If working in a Node.js or web environment, you can use fetch() or a library like Axios to call the APIs. Below is a conceptual snippet combining multiple calls (note: you'd need to insert a valid API key and perhaps adjust for real error handling):
|
const symbol = "AAPL"; const API_KEY = "YOUR_API_KEY"; Promise.all([ fetch(`https://financialmodelingprep.com/stable/historical-price-eod/full?symbol=${symbol}&apikey=${API_KEY}`), fetch(`https://financialmodelingprep.com/stable/technical-indicators/rsi?symbol=${symbol}&periodLength=14&timeframe=1day&apikey=${API_KEY}`), fetch(`https://financialmodelingprep.com/stable/technical-indicators/macd?symbol=${symbol}&timeframe=1day&apikey=${API_KEY}`) ]) .then(responses => Promise.all(responses.map(res => res.json()))) .then(([priceData, rsiData, macdData]) => { const latest = priceData.historical[0]; const prev20High = Math.max(...priceData.historical.slice(1, 21).map(d => d.close)); const volAvg20 = priceData.historical.slice(1, 21).reduce((sum, d) => sum + d.volume, 0) / 20; const latestRSI = rsiData[rsiData.length - 1].rsi; const latestMACD = macdData[macdData.length - 1]; const bullishMACD = latestMACD.macd > latestMACD.signal; if (latest.close > prev20High && latest.volume > 1.5 * volAvg20 && latestRSI > 70 && bullishMACD) { console.log(`${symbol} breakout confirmed by RSI, MACD, volume!`); } }); |
In this snippet, we fetch AAPL's last 100 days (full) data and technical indicators, then determine if the latest day meets our Level 3 criteria. This could easily be extended to loop through a list of symbols. (Note: FMP's free tier might have limits on the number of calls per minute, so consider batching requests or caching data as needed.)
3. Review and Iterate: When your system flags a breakout, review how that trade idea performs. Over time, you can refine thresholds. Maybe you find RSI > 65 is enough, or that requiring volume > 100% (double average) works better in certain markets. The beauty of having objective signals is that you can backtest them. Using FMP's historical data, you could simulate how many breakouts occurred in the past and how the stock behaved after. This adds confidence that your detection logic has an edge (or reveals that it needs adjustment).
4. Integrate into Dashboard/Reports: Since the target audience includes Dashboard/Reporting Users, note that you can pipe these signals into a dashboard for visualization. For example, you could highlight stocks currently in breakout mode, perhaps with color codes for weak/moderate/strong. Because FMP APIs also support CSV output and Excel integrations, even non-developers can use these signals - e.g., an Excel sheet that pulls today's data and uses formulas to check the conditions (Excel can fetch API data via Power Query or the FMP Excel add-in). The end result is a proactive system that tells you when a breakout is happening, rather than you hunting through dozens of charts.
Turning Breakouts into Reliable Signals
By translating visual technical analysis into rule-based data logic, we gain consistency and speed. Our Breakout Confirmation Ladder converted the art of breakout trading into a checklist that a computer (or a disciplined human) can follow objectively. This multi-indicator approach works because it addresses the why behind a breakout's success: a true breakout isn't just price up; it's price up with force, trend alignment, and broad participation.
Using FMP's broad indicator set and historical data, we were able to quantify those elements: moving averages for trend context, RSI for momentum, MACD for trend shifts, and volume for participation. This complements prior single-indicator tutorials by showing the power of combining signals - much like how seasoned traders do in practice. The result is a more reliable breakout signal. While no method can predict the future with certainty, stacking confirmations tilts the odds in your favor by filtering out many false breakouts (e.g., a price pop with low volume will fail our check, as it should).
Next steps: You can apply this approach to your own watchlist. Try using FMP's APIs to scan for breakouts on various stocks or even other assets like ETFs or crypto (the same principles often hold). For instance, test the ladder on last quarter's data and see which breakouts would have been flagged. You might discover patterns - perhaps certain sectors respond better to volume confirmation, or some breakouts work with only moderate volume if a news catalyst is present. With the flexible data at your fingertips, it's easy to iterate.
Detecting technical breakouts via API turns a once subjective task into a reproducible signal. It's a powerful addition to any quant or analyst's toolkit, ensuring you never miss a major breakout and helping validate which ones are worth acting on. As a final thought, consider integrating these breakout signals with other analysis (fundamental or otherwise) - a breakout that aligns with positive fundamentals or news can be especially potent.
FAQs
What is considered a technical breakout in stocks?
A technical breakout is generally defined as price moving above a defined resistance level (or below a support level) with momentum. For example, if a stock has failed to rise above $50 multiple times and finally surges to $52 on high volume, that's a breakout. It signifies a potential regime change where the prior trading range is left behind. The key components are a new high (or low) beyond a pivotal level and strong follow-through (not just a tiny peek above the line).
Which technical indicators best confirm a breakout?
Common indicators to confirm breakouts include volume, moving averages, RSI (Relative Strength Index), MACD, and others like ADX. Volume is crucial - a big volume spike confirms widespread interest. Momentum oscillators like RSI can confirm the strength of the move (e.g., RSI > 70 means the move is powerful). Trend indicators like moving averages or MACD confirm that the broader trend supports the breakout (e.g., price above the 50-day MA, bullish MACD crossover). Using several together gives the best confirmation, as described in our Breakout Confirmation Ladder.
How can I use FMP's API to automatically detect breakouts?
You can automate breakout detection by writing a script that fetches data from FMP and checks conditions. First, use the historical price API to get recent prices and volume for a stock (to know current price and compute past highs/avg volume). Then use technical indicator APIs like RSI, MACD, or moving averages. With those inputs, code the rules - for example: if (price > recentHigh && volume > 1.5×avgVolume && RSI > 70 && MACD_line > MACD_signal) then flag breakout. Run this script daily or in real-time (FMP offers intraday data too) to catch breakouts as they happen. Essentially, you're creating a scanner that mirrors what a human analyst would look for on a chart, but in data form.
Can technical breakouts fail even with confirmation?
Yes, even a breakout that checks all the boxes can sometimes fail. No signal is 100% foolproof - external factors (news, market shifts) can abruptly negate a breakout. High volume and strong momentum improve the odds of success but don't guarantee it. For example, a stock might breakout on great technicals but then drop if a negative news hits the next day (a false breakout or “bull trap”). That's why risk management (like stop-losses below the breakout level) is important. However, by insisting on confirmations, you are weeding out many low-probability setups and avoiding the weakest breakouts. Over a large sample, confirmed breakouts have a better chance of follow-through than unconfirmed ones, but always manage risk on each trade.
What timeframe should I use for detecting breakouts - daily or intraday?
It depends on your trading style. Daily charts (end-of-day data) are common for swing traders and analysts, providing a robust view of major breakouts and reducing noise. All the examples in this article used daily data. Intraday breakouts (e.g., on 5-minute or 1-hour charts) are important for day traders or very short-term strategies - FMP's API allows you to fetch technical indicators on intraday intervals as well. The principles are similar, but shorter timeframes will have more frequent, smaller breakouts (with more false signals). For most purposes, starting with daily data to identify significant breakouts is recommended, and then you can drill into intraday data if needed (for example, to time an entry or see intraday confirmation like volume spikes on the breakout minute).
Does an overbought RSI (>70) always mean a breakout is impending?
Not necessarily. An RSI above 70 simply means the stock has had strong recent gains - it's overbought by classical definition. This often happens during or after a breakout, but an elevated RSI on its own could also occur within an existing trend (without any resistance level being broken). In fact, sometimes an RSI > 70 might warn that a move is overextended and could pull back. The context matters: if RSI > 70 coincides with a price breaking out of a range, it's confirming momentum; but if RSI > 70 and price is just in the middle of nowhere (no key level nearby), it's not a “breakout” by itself, just a strong rally that might even reverse soon. So, use RSI in combination with price action (and ideally volume) to identify true breakouts.

Top 5 Defense Stocks to Watch during a Geopolitical Tension
In times of rising geopolitical tension or outright conflict, defense stocks often outperform the broader market as gove...

Circle-Coinbase Partnership in Focus as USDC Drives Revenue Surge
As Circle Internet (NYSE:CRCL) gains attention following its recent public listing, investors are increasingly scrutiniz...

LVMH Moët Hennessy Louis Vuitton (OTC:LVMUY) Financial Performance Analysis
LVMH Moët Hennessy Louis Vuitton (OTC:LVMUY) is a global leader in luxury goods, offering high-quality products across f...

