FMP
How to forecast stock prices using FMP news, stock price targets and financial statements estimates.
May 21, 2025
Today I want to show you one simple way of forecasting stock prices using Financial Modeling Prep's news, stock price targets and financial statements estimates and one cool Chrome extension. But before we start, it's worth mentioning that no one can accurately forecast the stock price, as there are so many factors that come into play and they can be very contradictory in nature. For example, a company can post better-than-expected earnings, but some financial investigation may start against the company, and you won't be able to tell how this will affect the stock price if it posts positive and negative news at the same time. Or another example is when a larger institutional investor is selling the stock at the market, provoking panic selling. You never know when this will happen. Extraordinary things can happen and you won't be able to forecast the outcome and when those things will happen. Please always take this into consideration when forecasting your stock price. But if things go as expected, meaning that there is no stressful news, or multiple events happening with the company at the same time, and when larger players are not actively trading the stock, we can forecast the stock price with some degree of accuracy, and this is where useful data and one cool extension come into play.
Forecast stock prices. Initial setup.
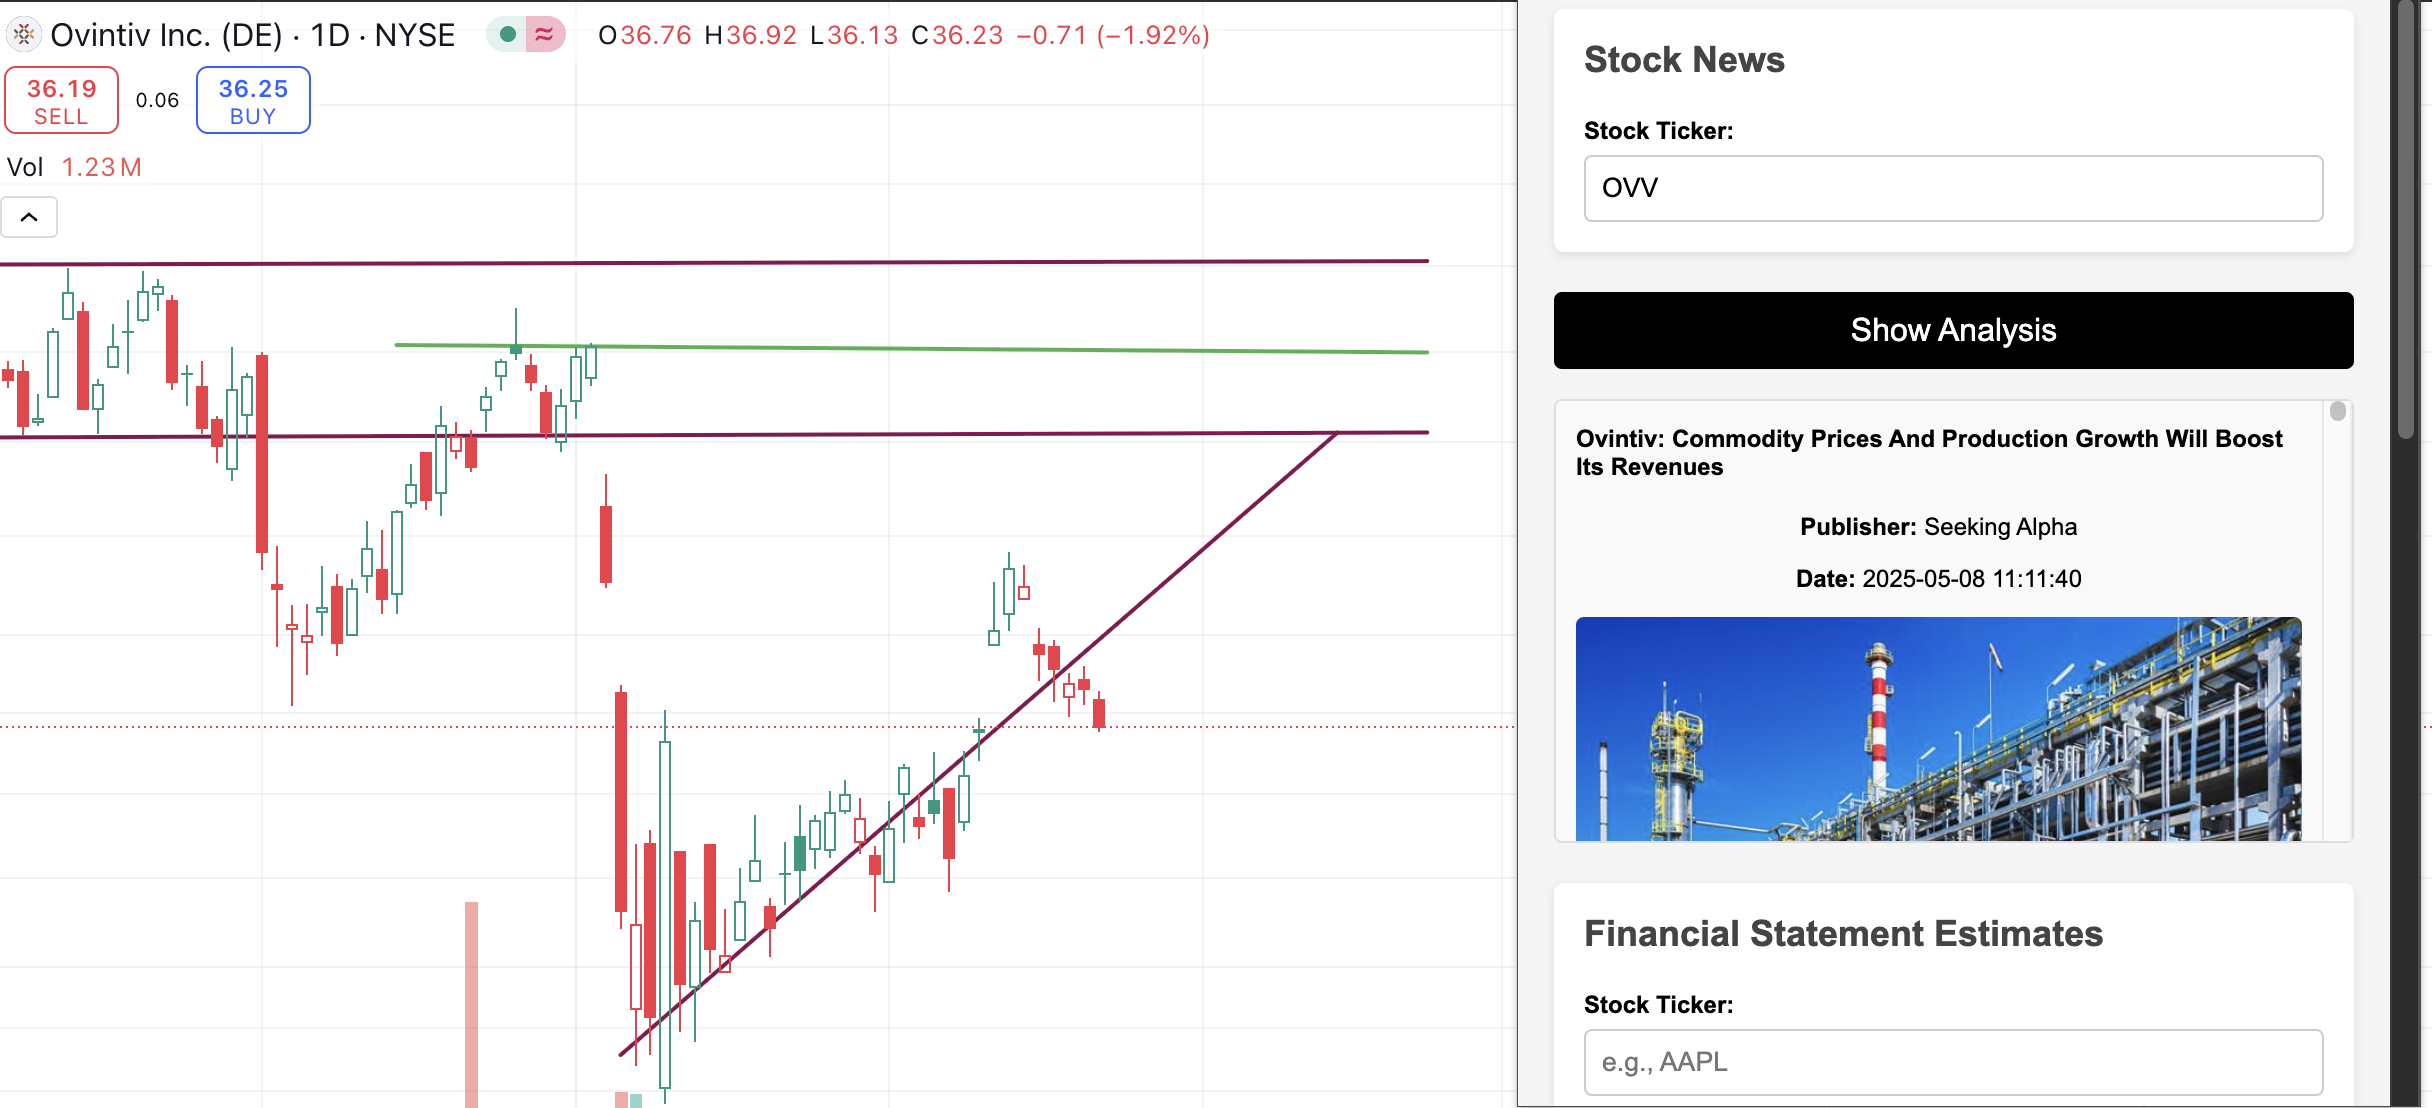
To start with your forecast, you would need to open the stock graph, using any website or app, and locate support and resistance levels on the graph, like shown in the picture below. The support is where bigger players usually place their buy orders, and the resistance is where bigger sellers want to sell their shares. Look at the graph and see where the falling stock starts to bounce back. This should repeat many times if you look from the historical perspective. Also pay attention to volumes. When the stock is bouncing back, the volumes should also go up, meaning that buyers are taking over. Same applies to the resistance level. When the rising stock starts falling, supported by rising volumes, and also when it reached the same level in the past and couldn't break it, it means that some larger player is not letting it grow, selling at that level. Your levels should look similar to mine. I am taking the OVV share as an example.

After plotting the support and resistance levels, add events to the timeline to see when the company posted its earnings and if it paid dividends. Then download the Stock News and Forecast Extension from the Chrome Web Store. You need to use a Chrome browser to use this extension. Also, your stock graph (OVV in my example) should be open. It will be convenient to use the extension together with the graph open so that you can make a more accurate forecast.
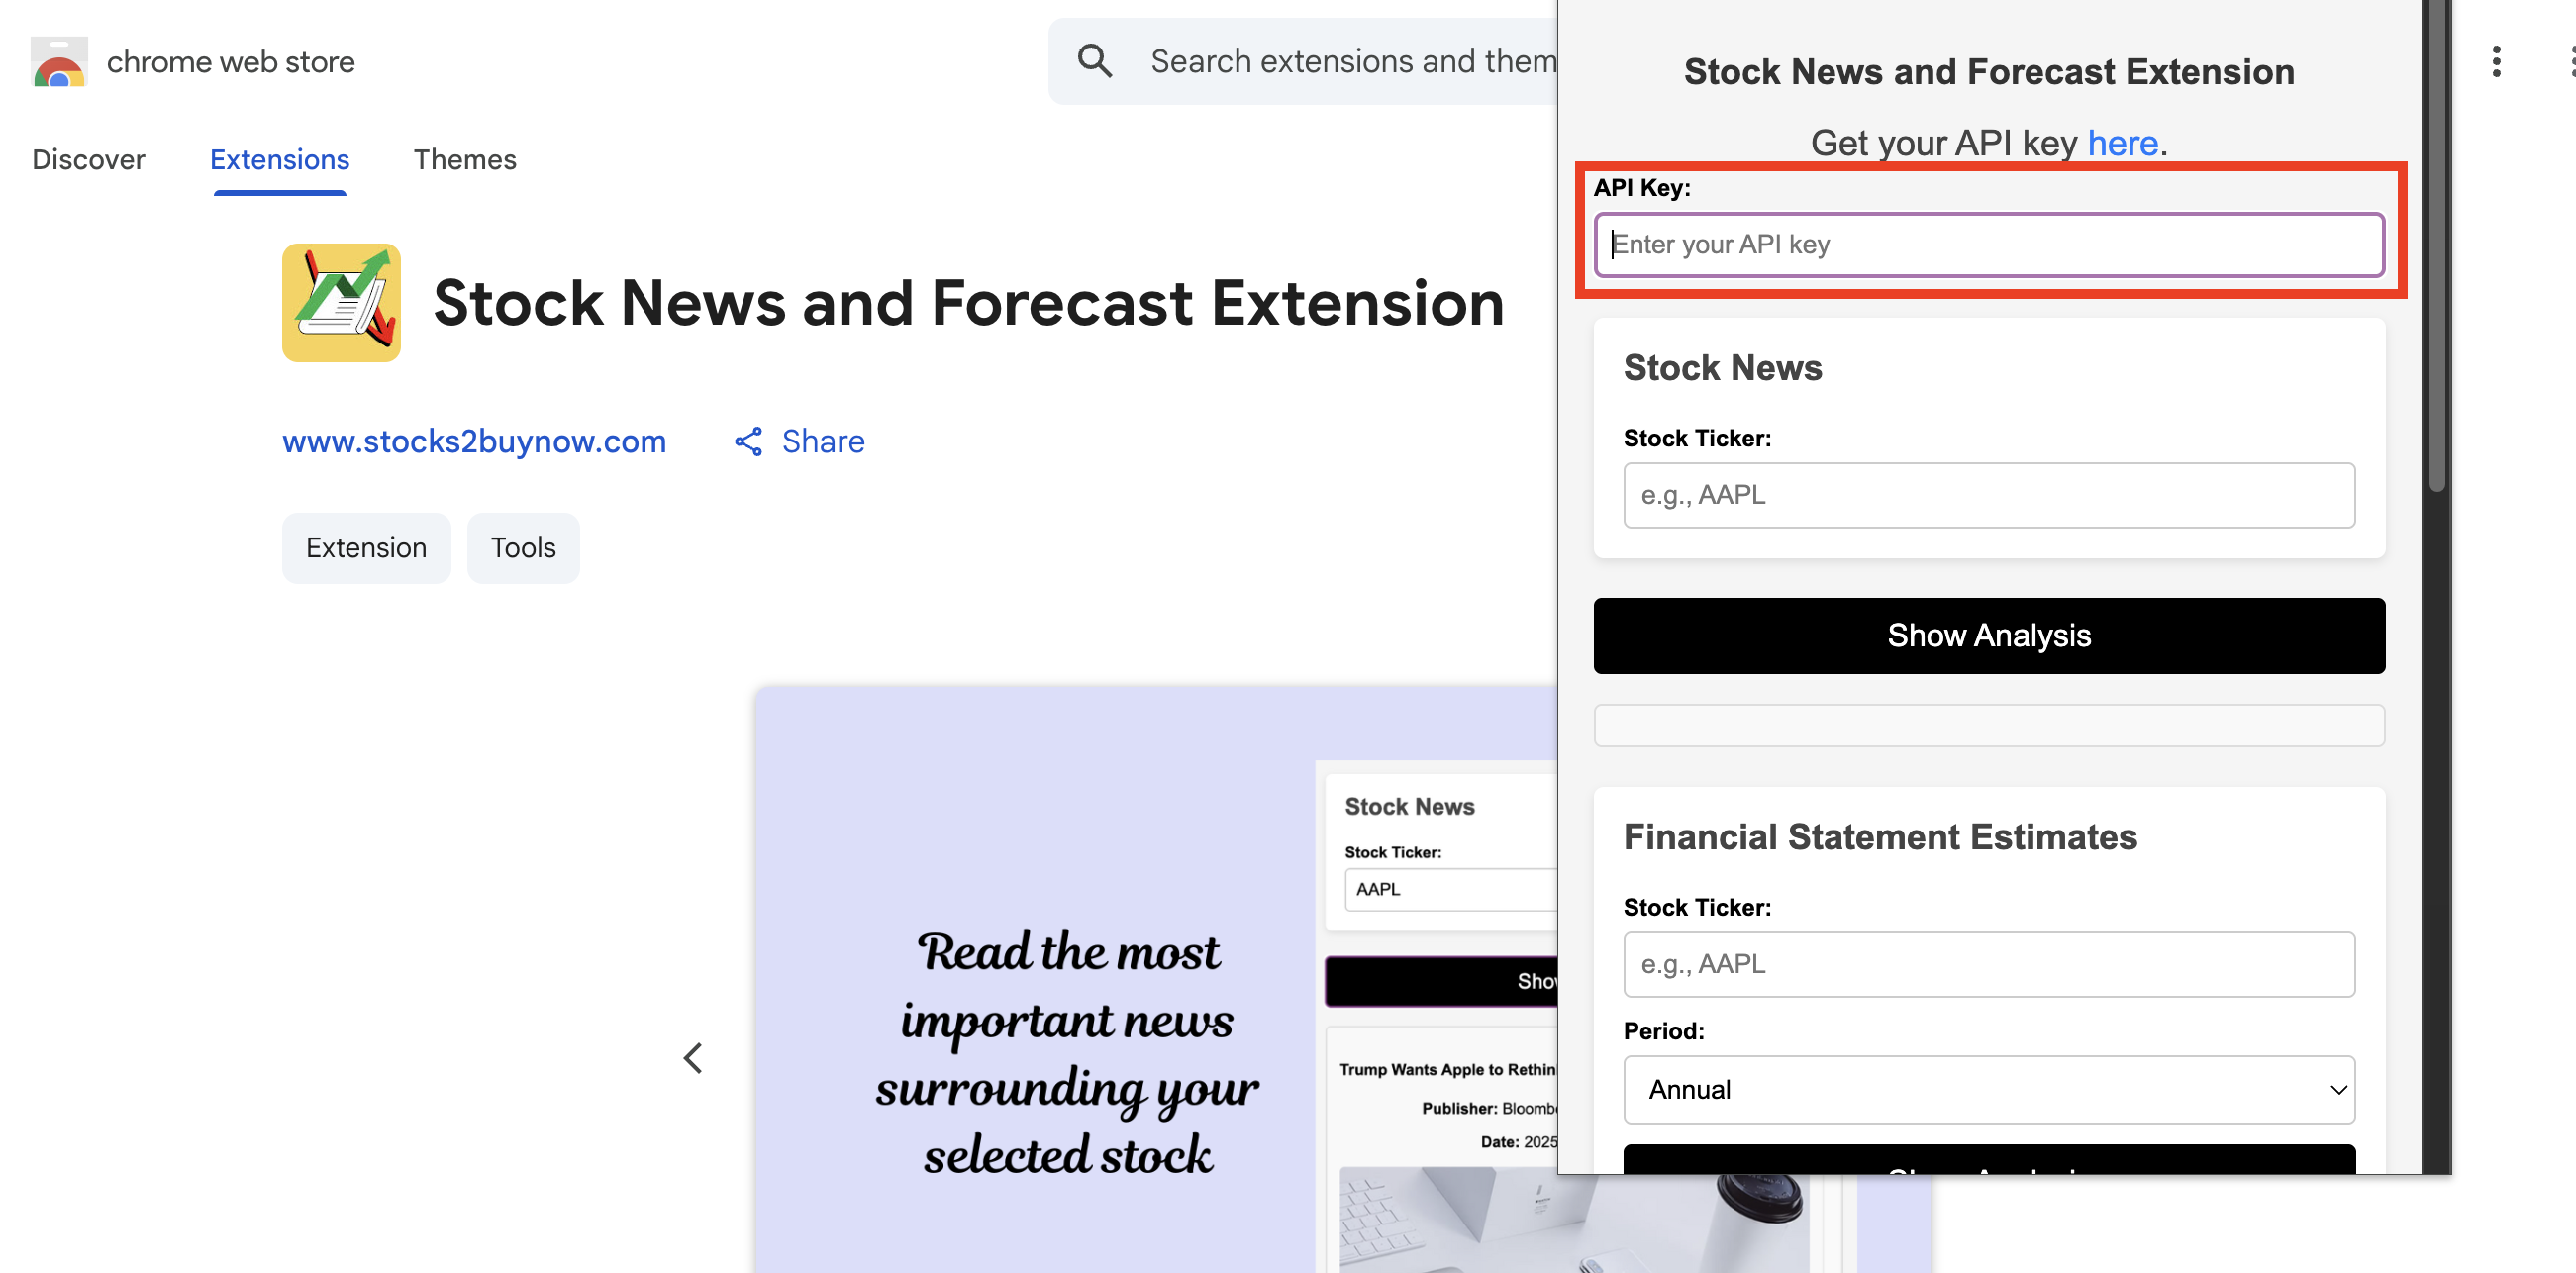
After downloading the extension, in its settings, pin it to the toolbar, open it and input your custom API key that you can get after registering with Financial Modeling Prep (FMP). You would need this key to get news, stock price targets and financial estimates that are provided by the FMP. Input your API key in the field that says “Enter your API key” as shown in the below picture.
Forecasting sentiment by reading the most important news.
After that, it's time to analyze your stock. Go to the Stock News field and input the stock ticker OVV in our example inside the Stock ticker field and hit the Show Analysis button. Since OVV is an oil and gas company, soft commodity prices can boost the stock price, and the first news we see says “Commodity Prices And Production Growth Will Boost Its Revenues” meaning that we can expect some upside in the shorter term. Although the stock is experiencing short-term decline by the time I write this article, more positive news can change this falling trend. The image with the example is below.
Keep scrolling news. If you see a lot of positive news, like revenues beat estimates, analysts raised the stock target price, or the company managed to decrease costs, for example, this can bring more positive sentiment and attract attention from larger players, pushing the stock upwards. Negative news can lead to the stock going lower.
See analyst expectations on your selected company.
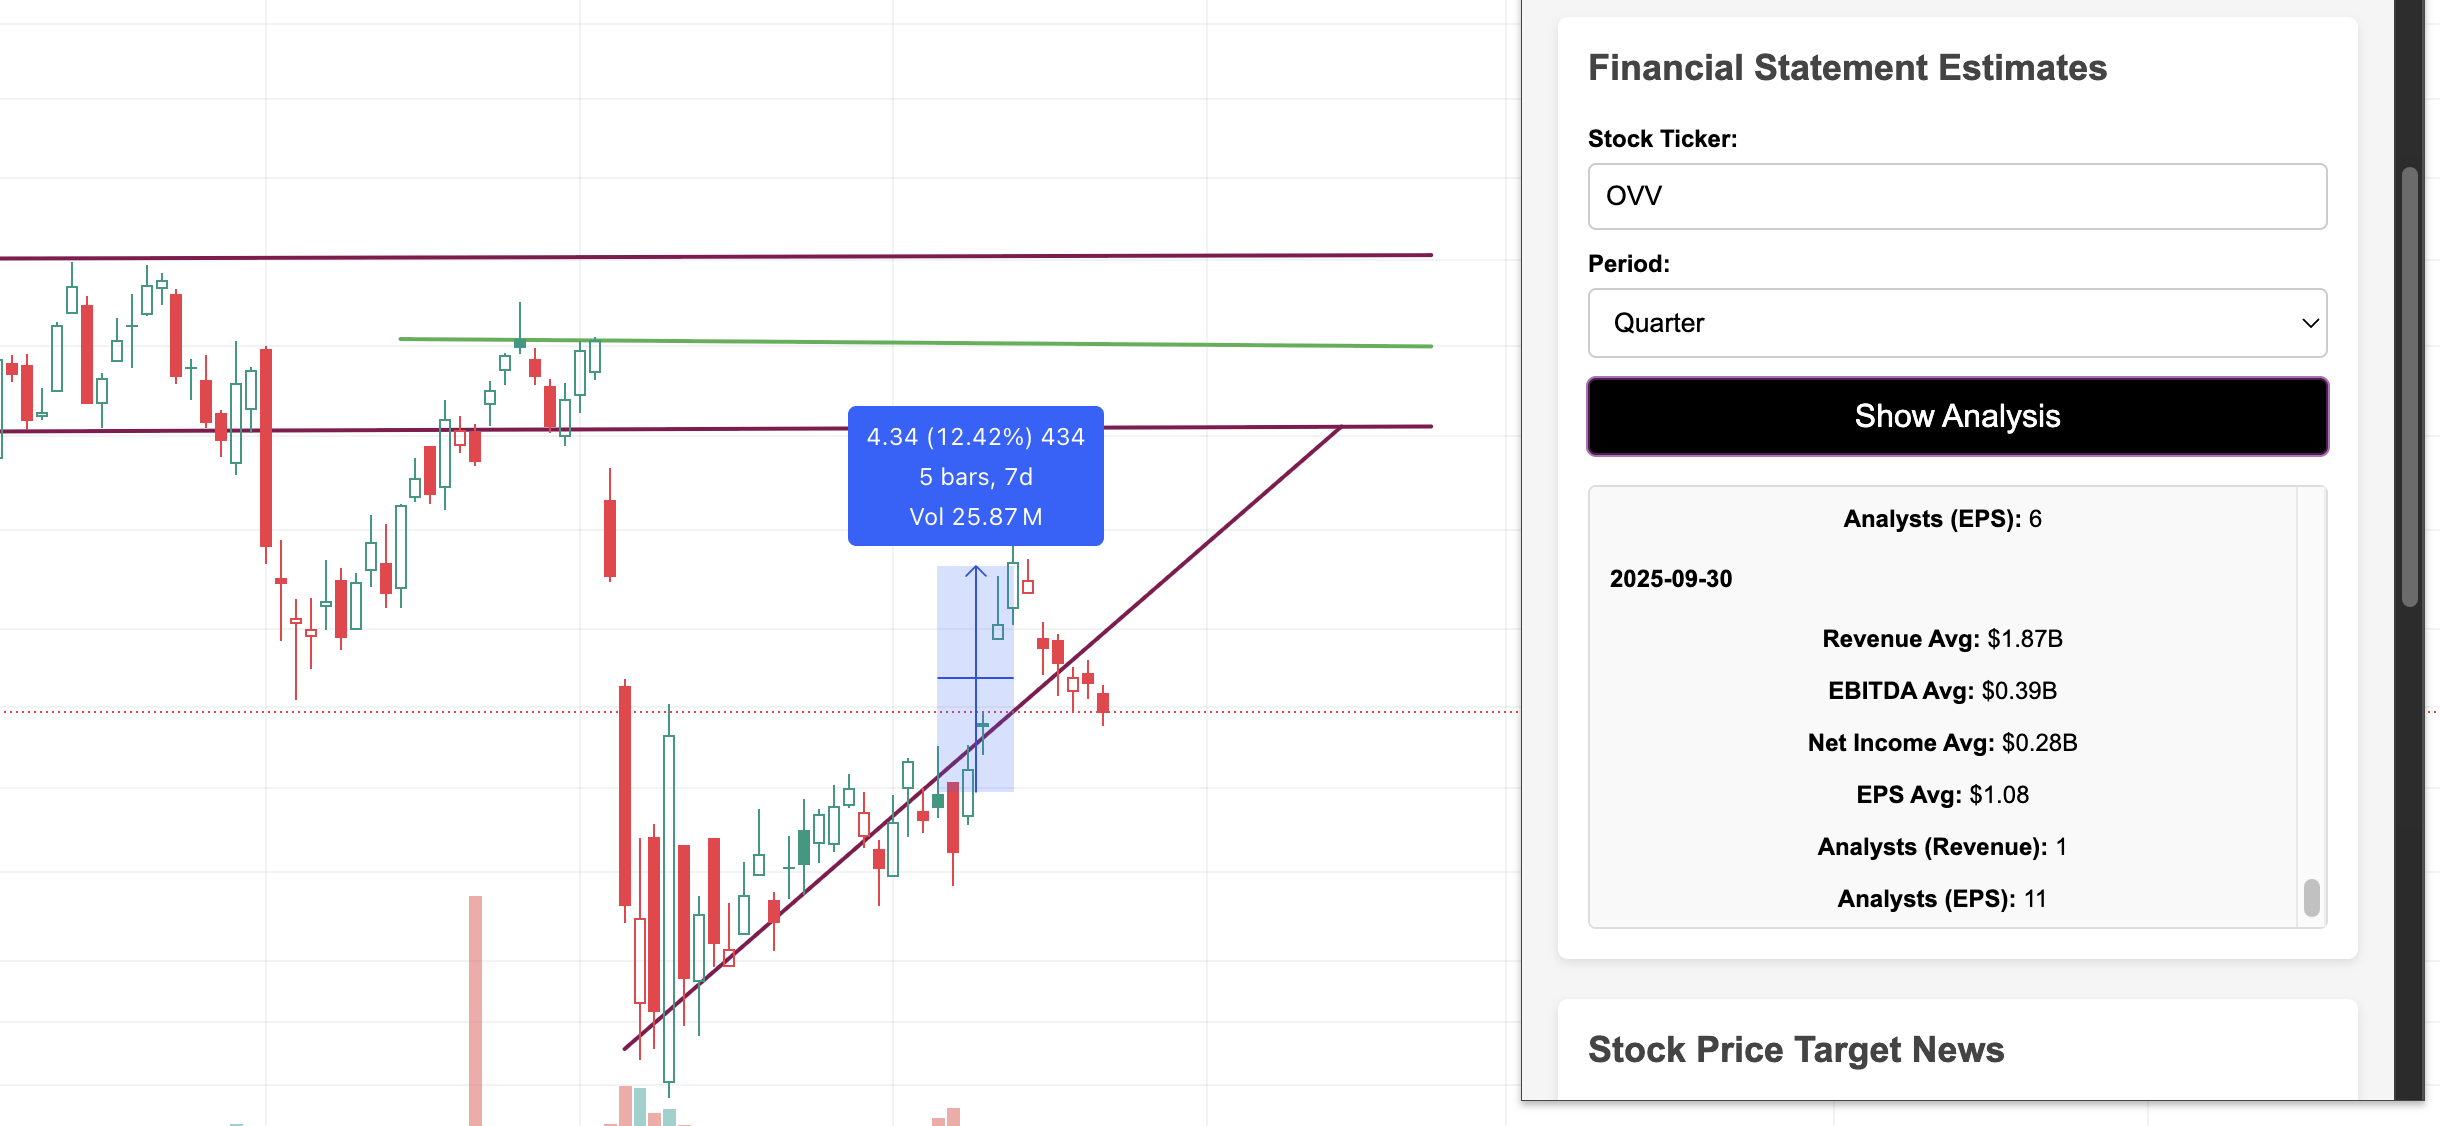
Next, go to the Financial Statements Estimates inside the extentsion, input the stock ticker, choose the period as Quarter, and hit the Show Analysis button. See the upcoming earnings forecast, the closest one, which is for September 2025 in our case. The estimates are showing the number of analysts who were involved in the calculations. 11 analysts calculated the EPS estimate, which is $1.08 (average estimate). And a revenue estimate is 1.87B. The company posted higher revenue and EPS in the last quarter (actual revenue and EPS), and if the company will stay on this revenue and EPS trend, posting higher-than-expected numbers, it can lead to the stock upside. As we see from the graph, the company's stock gained 12% in value in 5 days after the company showed better-than-expected earnings. And if a good earnings trend will continue (if the company will post better-than-expected numbers on its next reporting date), the stock price can repeat this behavior, and we can expect 10-15% upside if no extraordinary things happen. Worse-than-expected numbers will lead to the stock price decline. A vintage analysis shows that the stock can lose around 25% in value during bad results or unexpected events. That's why if the company won't be able to beat earnings estimates, it can lead to a sharper price decline. The image with earnings estimates is seen below.
Scroll up on the earnings estimates. If you see that analysts are raising their estimates constantly, this is a good sign, which means that they are optimistic about the company and we should expect company's revenue and EPS to grow.
Get stock price targets calculated by top investment analysts.
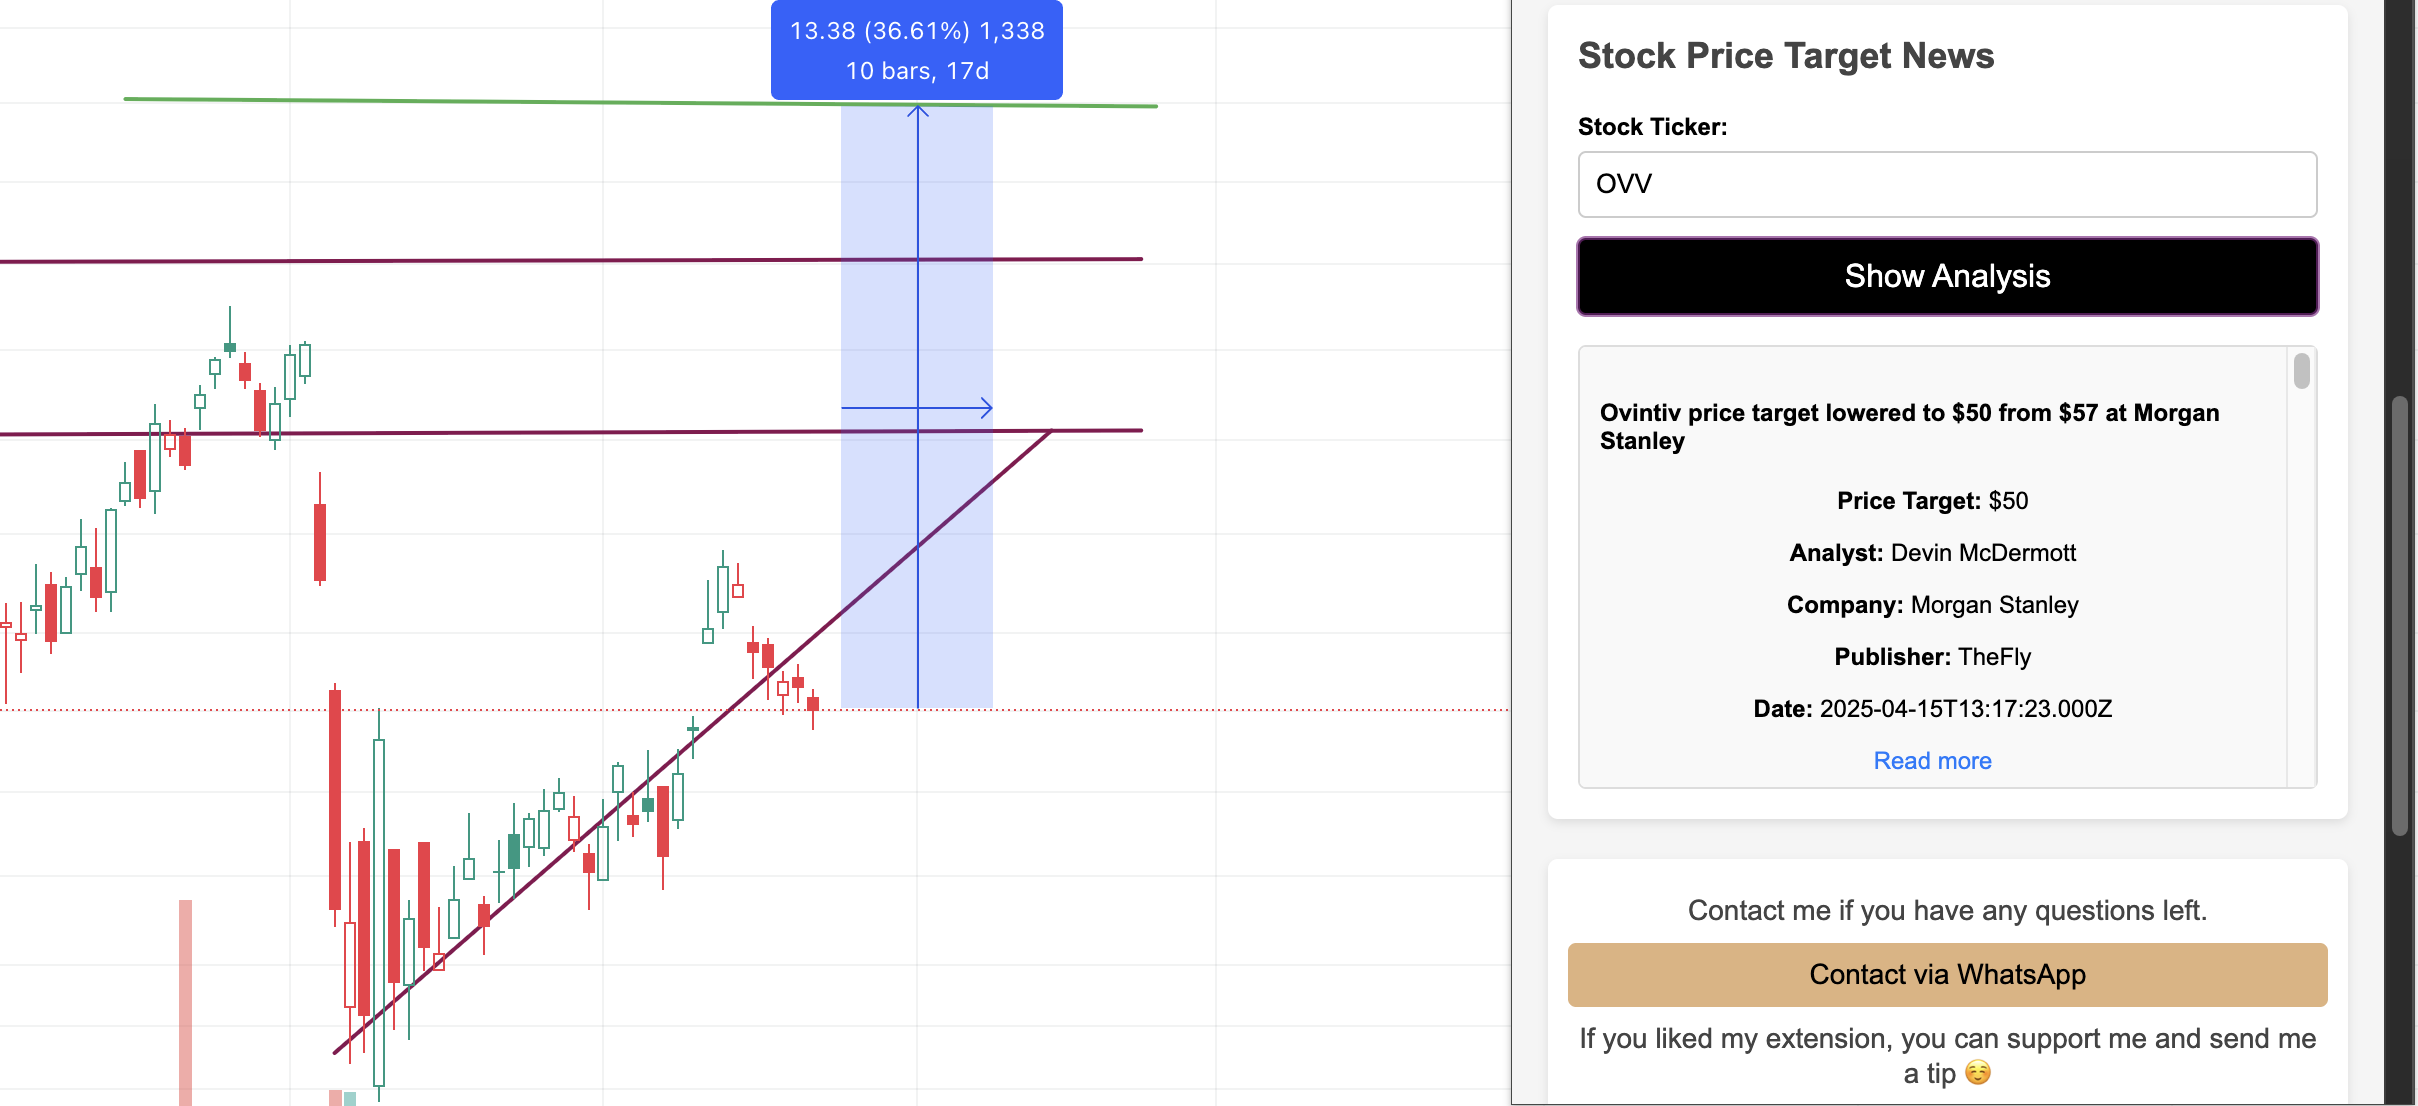
Next, go to the Stock Price Target News Section within the extension. Input the stock ticker and hit the Show Analysis button. And you will be able to see the most recent target prices calculated by top investment analysts. For example, Devin McDermott from Morgan Stanley set a target price for the OVV shares at $50, meaning that the stock has more than 36% growth potential from the current price of 36 based on the Devin McDermott expectations. Scroll down on this section to see other investment analysts' target prices for OVV, and calculate the average target price from all the analysts from the extension. Since different analysts have different assumptions and levels of confidence in the company, using the average target price will smooth out the picture and give you a more accurate stock target price.
Now let's make a quick summary and see where the stock price can go based on our analysis. But please keep in mind that no one can forecast the stock price accurately, and we can only make our assumptions based on company analysis, trading history, and analyst estimates. And please keep in mind that unexpected things can always happen. Now let's see where the stock can head under different scenarios.
Forecasting your selected stock's price under three different scenarios
Positive scenario (green line). The stock can keep rising, reach its dividend day, and go higher. It went slightly higher during the last dividend payment, so the history can repeat. Then it can reach its resistance level (at 42) and stay there for some time. Then keep checking the extension regularly. If we see that analysts are raising their target prices and financial estimates (Revenue and EPS), this can boost the stock price, and it can start trading near its second resistance level (at 46), as shown in the below picture. Then, if the company posts better-than-expected Revenue and EPS, it can lead to 10-15% more upside (as was in the last reporting quarter where the company posted better-than-expected numbers and its share price gained 12%), and the stock can reach its target price of $50 set by Devin McDermott.
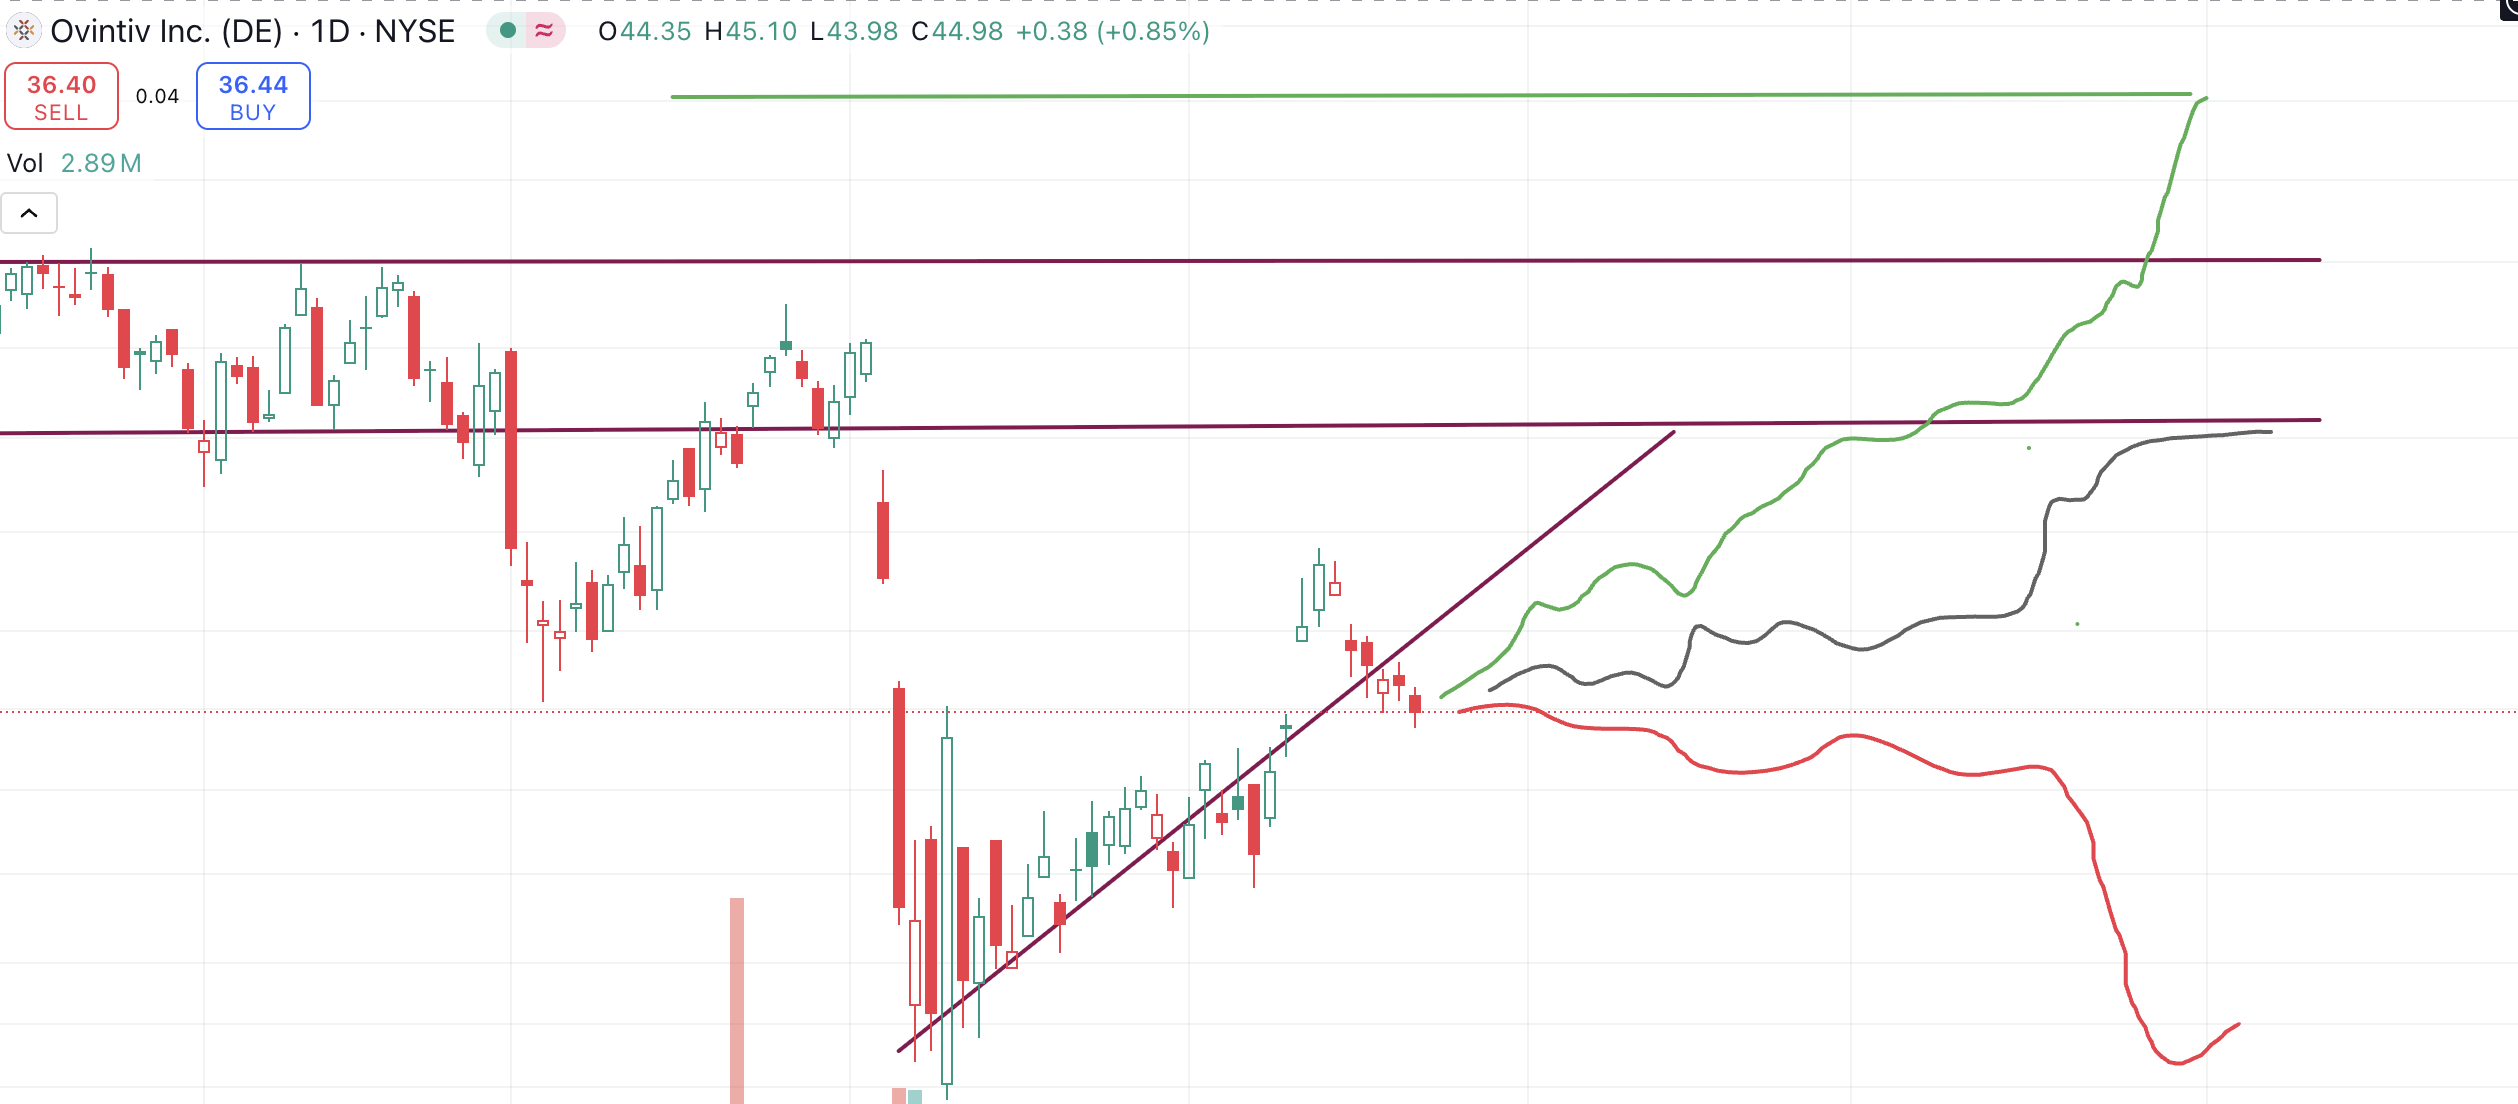
Neutral scenario (grey line). Under the neutral scenario, the stock can keep trading flat, then gain in value on its next dividend payment date (June 13th), then keep trading flat, driven by low investor confidence and market tensions, and finally go slightly higher (driven by upgraded revenue and EPS expectations — check the extension), touching its resistance level (at 42) and then staying on that level (trading flat).
Negative scenario (red line). Under the negative scenario, the stock can start sliding lower slowly, as investors won't be sure if they should start selling this stock heavily or hold because the company has somewhat good fundamentals. But it will still slide lower if news surrounding the company appear to be negative. Regularly monitor news to forecast investor sentiment. Then the stock may start falling more aggressively ahead of earnings, if analysts lower their revenue and EPS estimates, and finally, if the company posts worse-than-expected earnings, it can lead to a sharper decline, and the stock can reach its local minimum (at 30), as shown in the above picture.
Please note that this is only the forecast, but changes in analyst financial estimates, stock target prices or worsening news can lead to a different picture. Always do your own research before opening positions, and read analyst estimates and management letters before buying shares, and of course, regularly check the extension.
The Stock News And Forecast extension is using the Financial Modeling Prep API endpoints to fetch the data and show you a good summary that you can use in forecasting your stock's price. The endpoints used by the extension are:
Search Stock News API Endpoint
Financial Estimates API Endpoint
Price Target News API Endpoint
Thanks for reading the article. I hope it was useful and now you have basic stock forecasting skills and understand how to forecast the stock trend.

How an Economic Moat Provides a Competitive Advantage
Introduction In the competitive landscape of modern business, companies that consistently outperform their peers ofte...

Apple’s Slow Shift from China to India: Challenges and Geopolitical Risks
Introduction Apple (NASDAQ: AAPL) has been working to diversify its supply chain, reducing dependence on China due to...

MicroStrategy Incorporated (NASDAQ:MSTR) Earnings Preview and Bitcoin Investment Strategy
MicroStrategy Incorporated (NASDAQ:MSTR) is a prominent business intelligence company known for its software solutions a...