FMP
How to use FMP economic calendar with Google Sheets and why it’s important for traders.
May 26, 2025
Why the Economic Calendar is Important for Stock Traders
An economic calendar is a critical tool for stock traders because it provides a schedule of key economic events, data releases, and policy announcements that can significantly influence financial markets. These events often drive market volatility, affect investor sentiment, and impact stock prices. Understanding and leveraging the economic calendar helps traders anticipate market movements and make informed trading decisions.
Traders can integrate economic calendar data into their stock price forecasting process by combining event analysis with fundamental analysis. Here's a step-by-step guide on how to use this data effectively:
- Monitor Key Events:
- Macro Indicators: GDP, CPI, unemployment, PMI, consumer confidence.
- Central Bank Announcements: Interest rate decisions, Federal Reserve or ECB statements.
- Focus on events marked as “high impact” or with significant historical market influence (e.g., Non-Farm Payrolls, FOMC meetings).
- Understand Event Impact:
- A strong jobs report might boost the broader market but could lead to fears of tighter monetary policy, hurting high-growth tech stocks.
- Positive housing data might lift homebuilder or real estate stocks.
- Research how specific events historically affect the market or individual stocks.
- Analyze Expectations vs. Actuals:
- Beat: If actual data exceeds expectations (e.g., GDP growth of 3%), stocks may rally, especially in cyclical sectors like industrials.
- Miss: If data underperforms (e.g., GDP growth of 1.5%), stocks may decline, particularly in growth-sensitive sectors.
- In-line: Minimal market reaction unless the event was highly anticipated.
How to get economic calendar in Google Sheets.
To get valuable calendar for different economic events, we would need a Google Sheet and Financial Modeling Prep.
First, connect FMP to Google Sheets using this instruction.
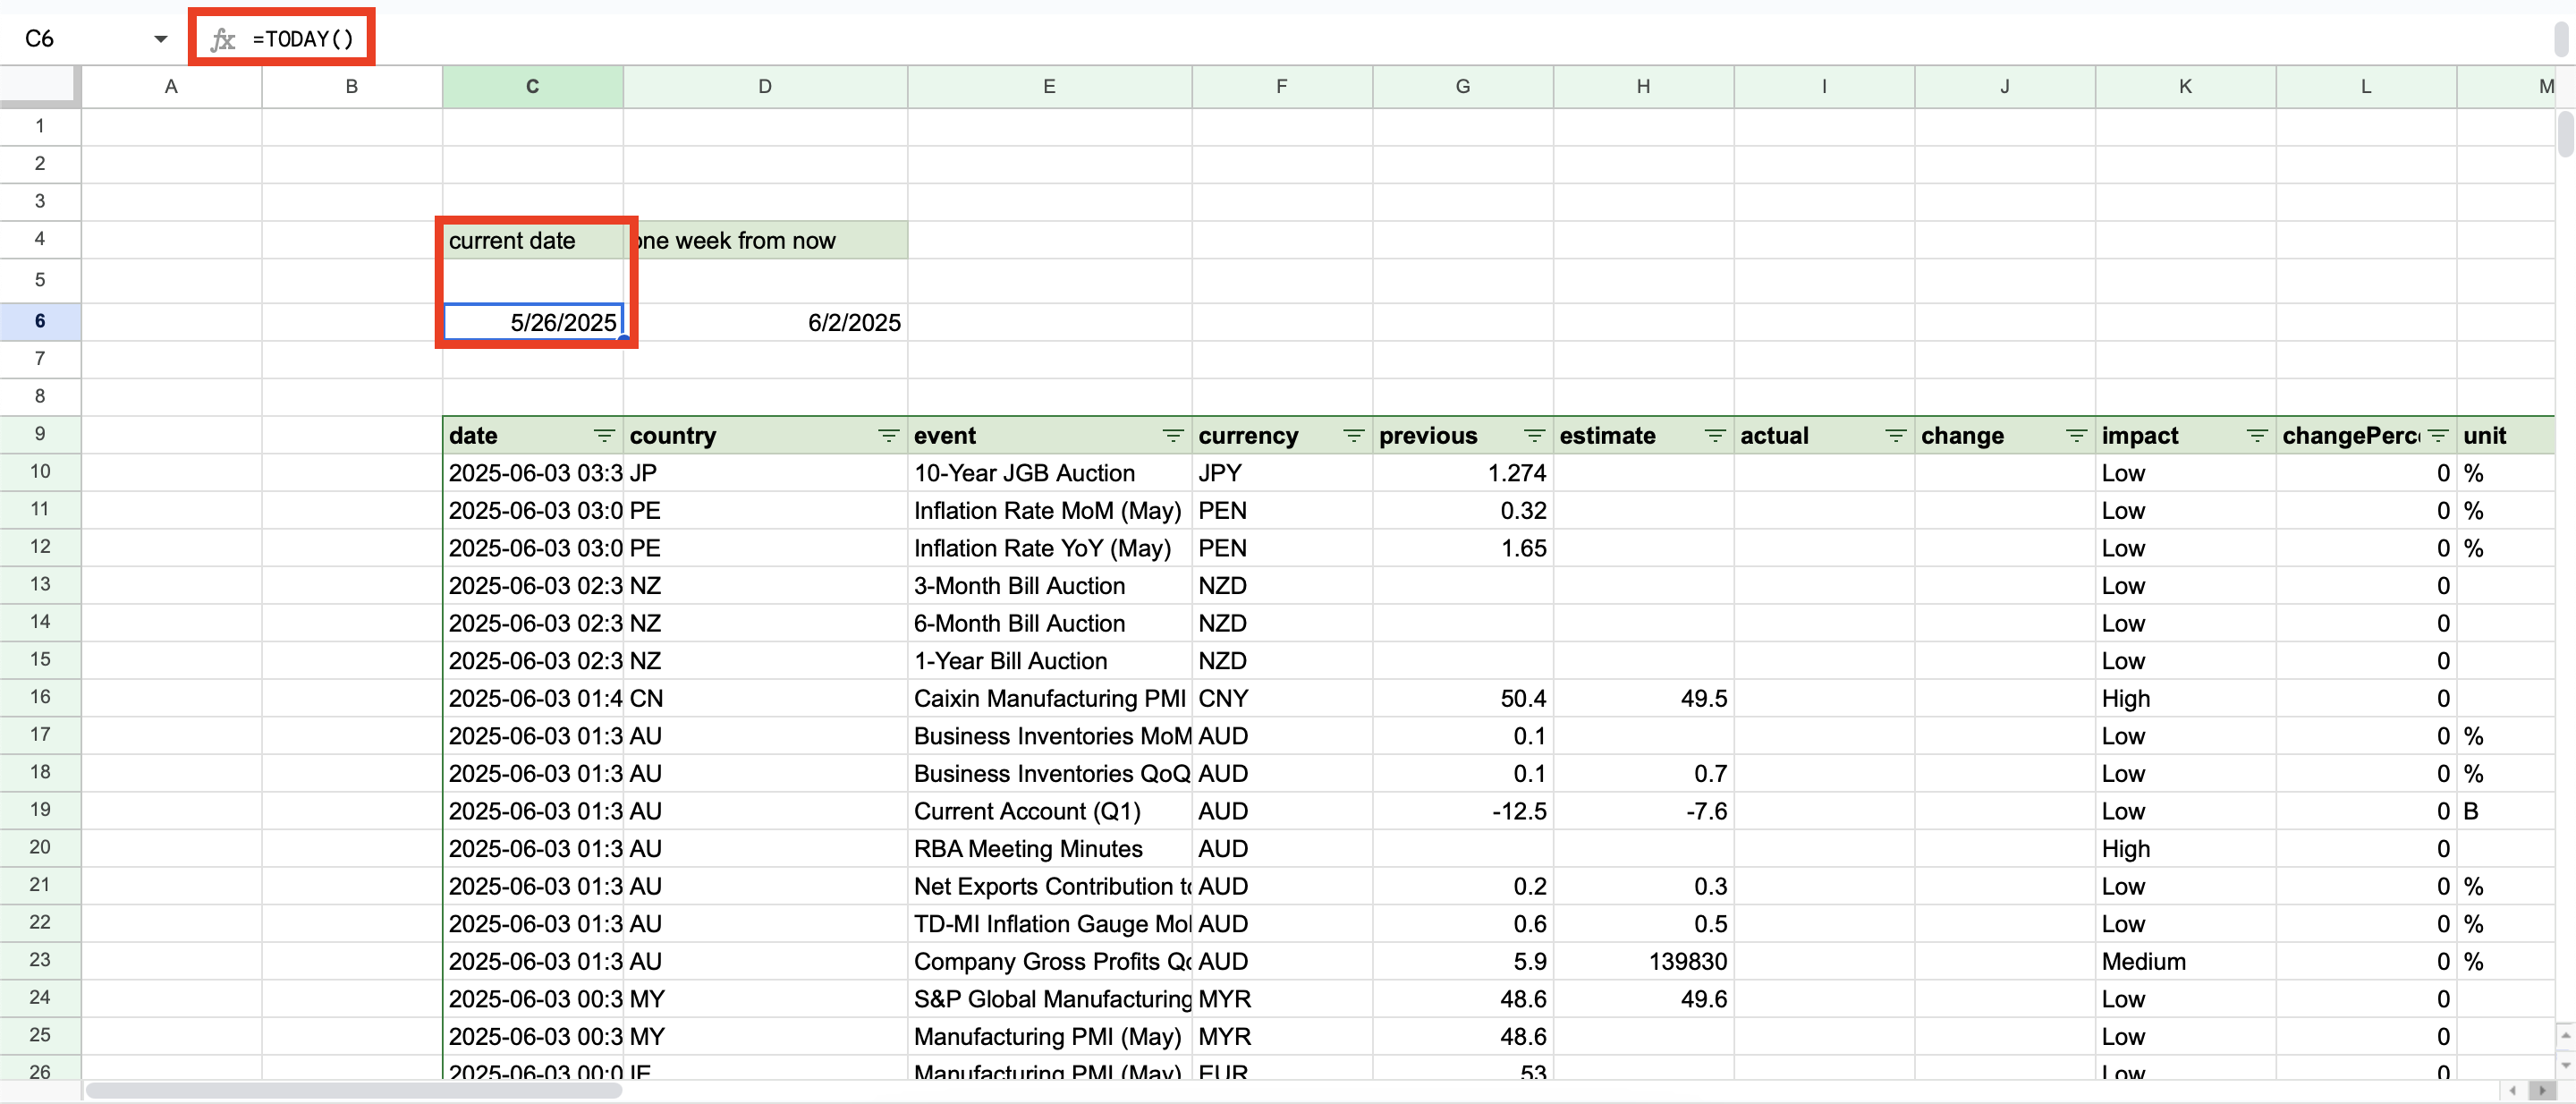
After that, open the Google Sheet and create the date range, from the current date to the one week from now. The calendar will show different economic events with forecasts for that date range. Your calendar can look like the image below.
As you can see, I have a current date (made using the "=TODAY()” formula in Google Sheets, the below image )
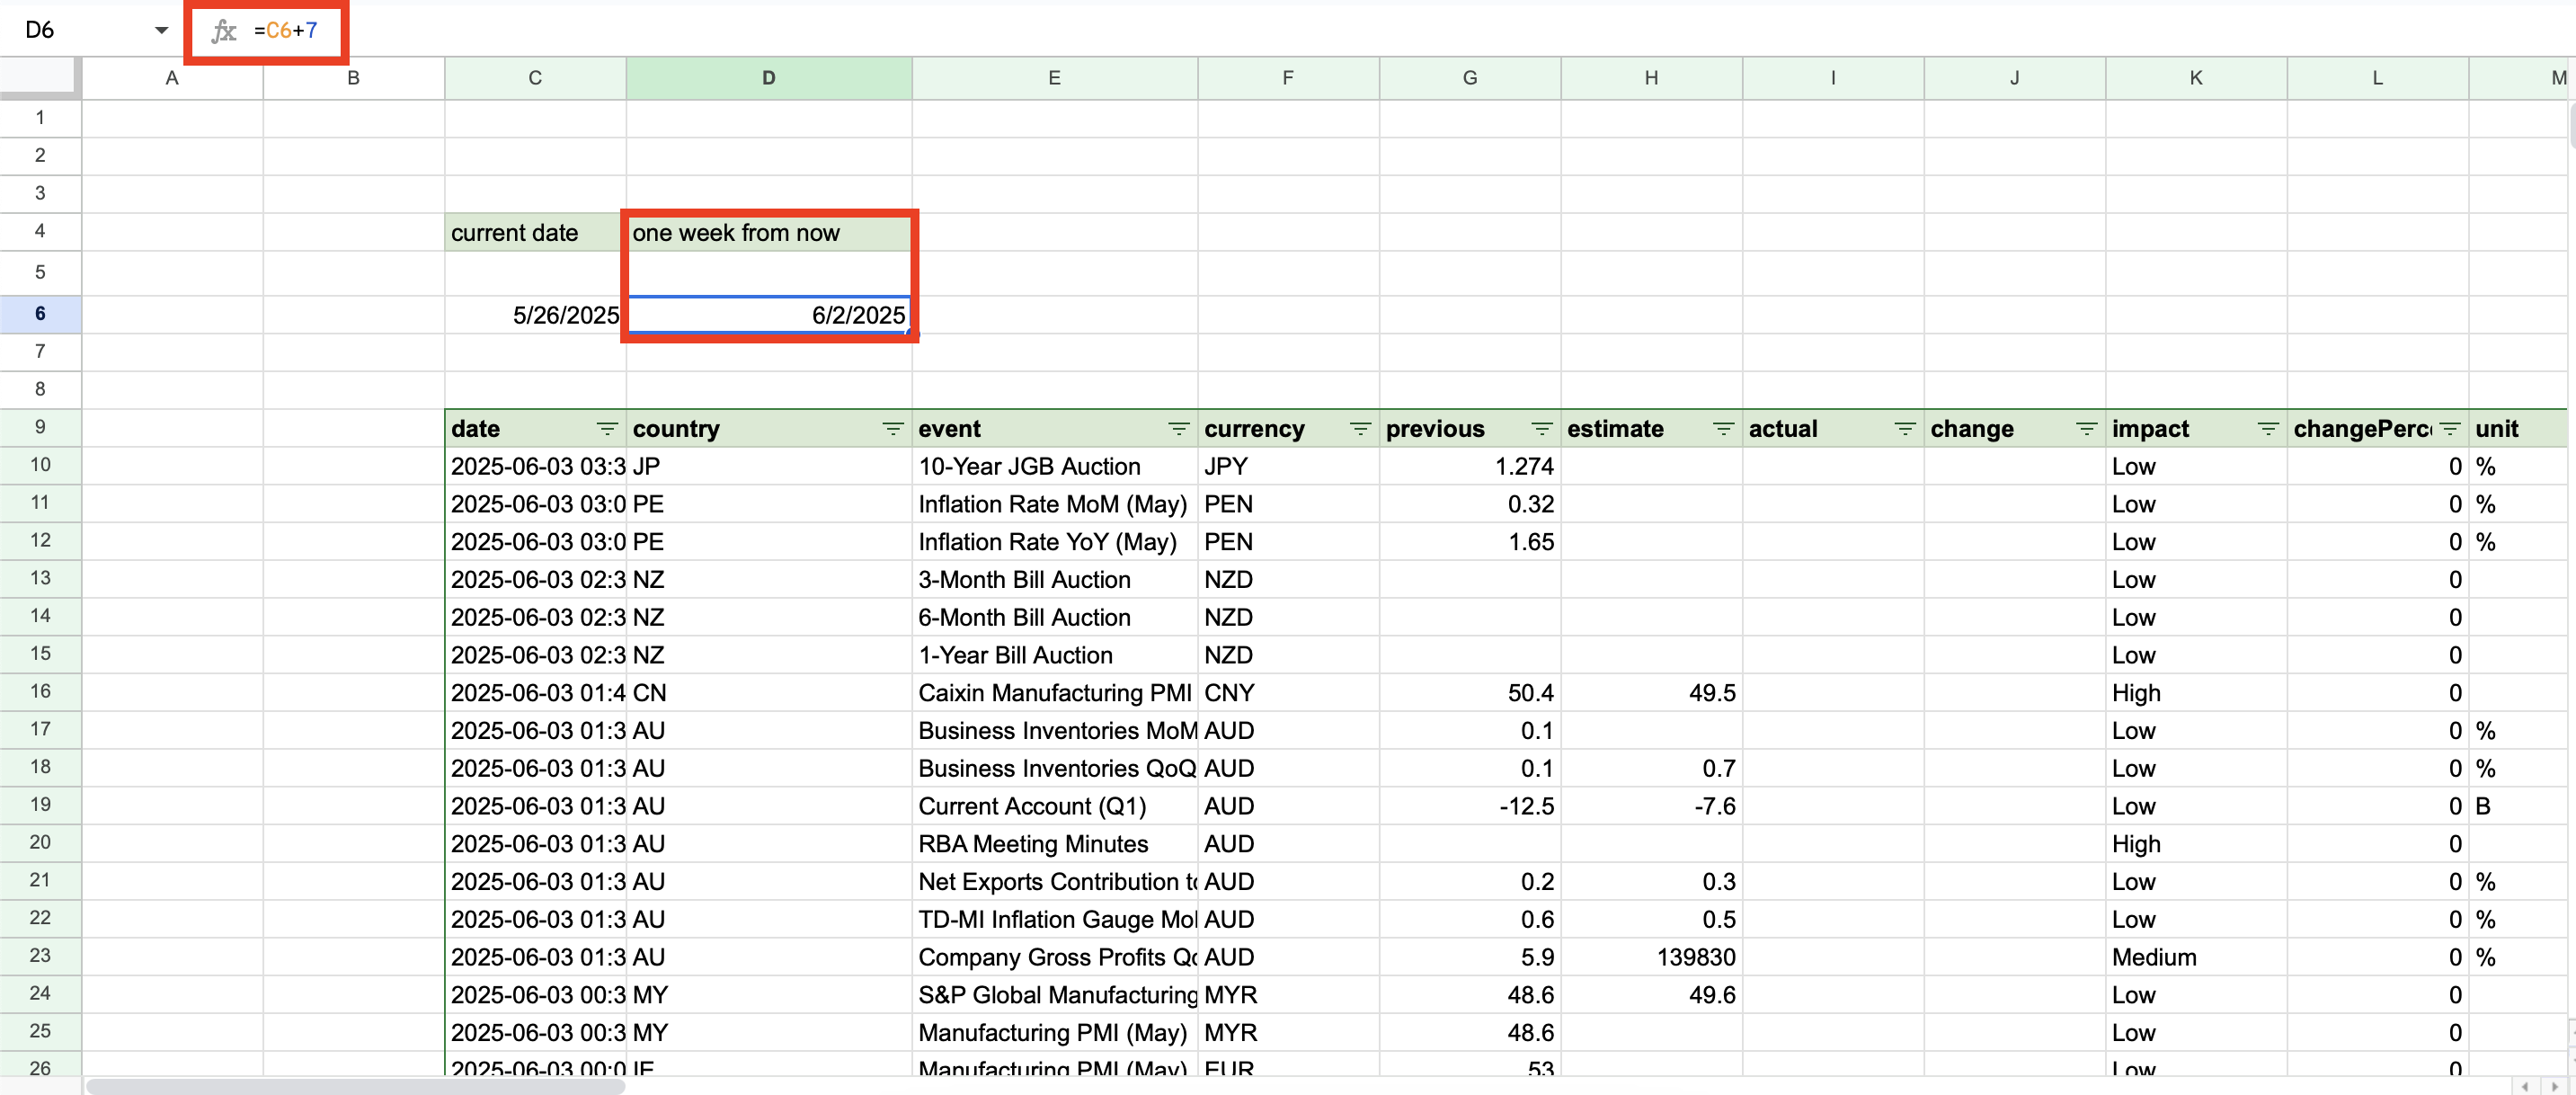
The next step is to add 7 days from now. To the previous formula, add the 7 as shown in the picture below.
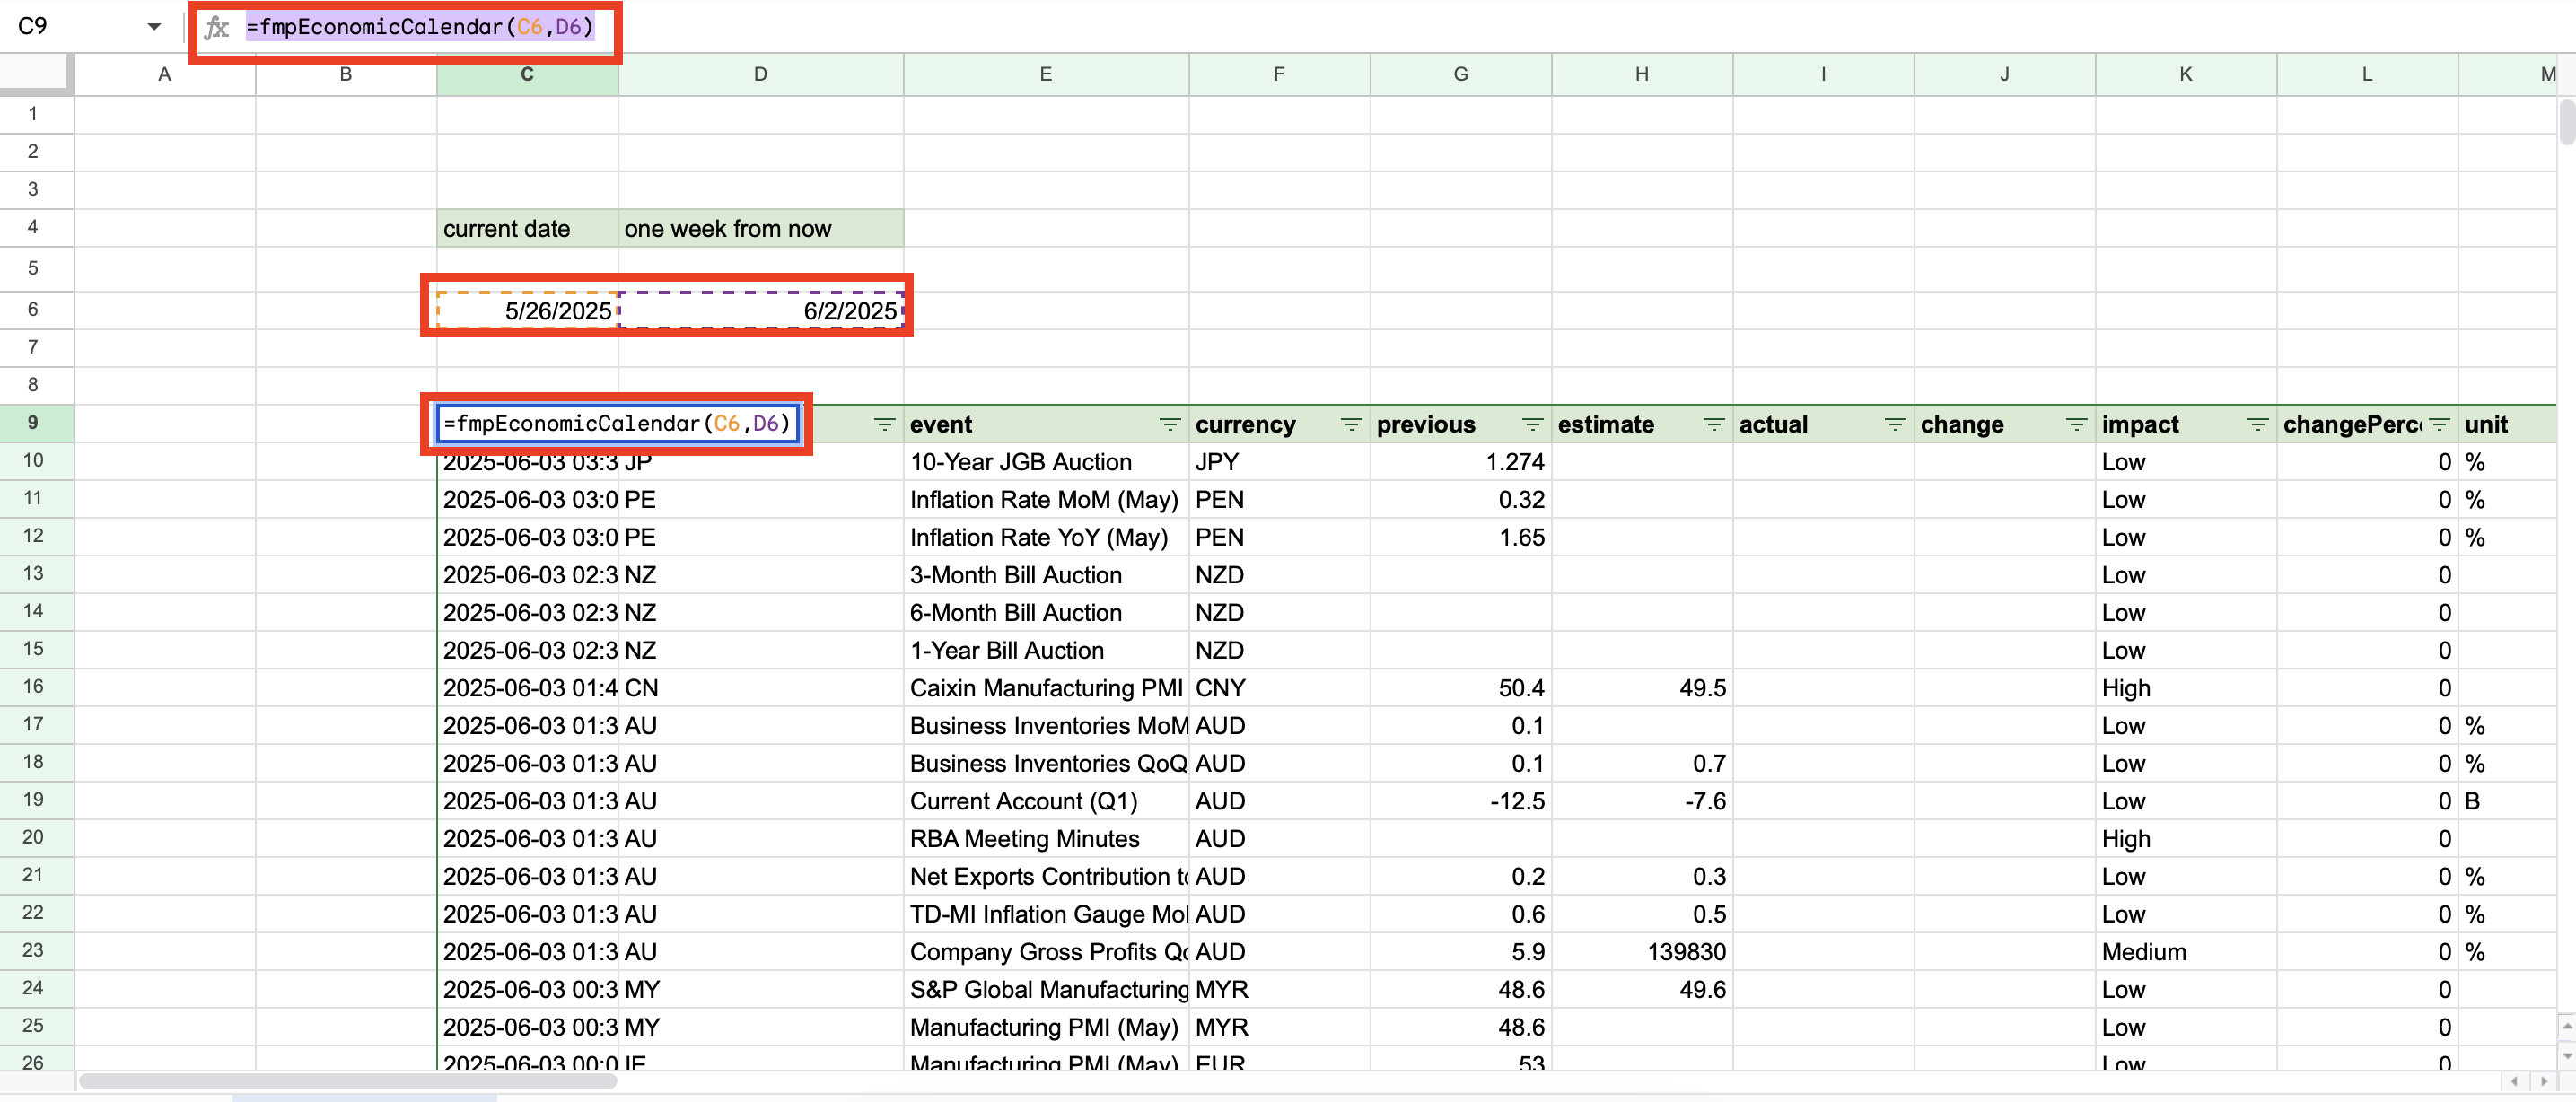
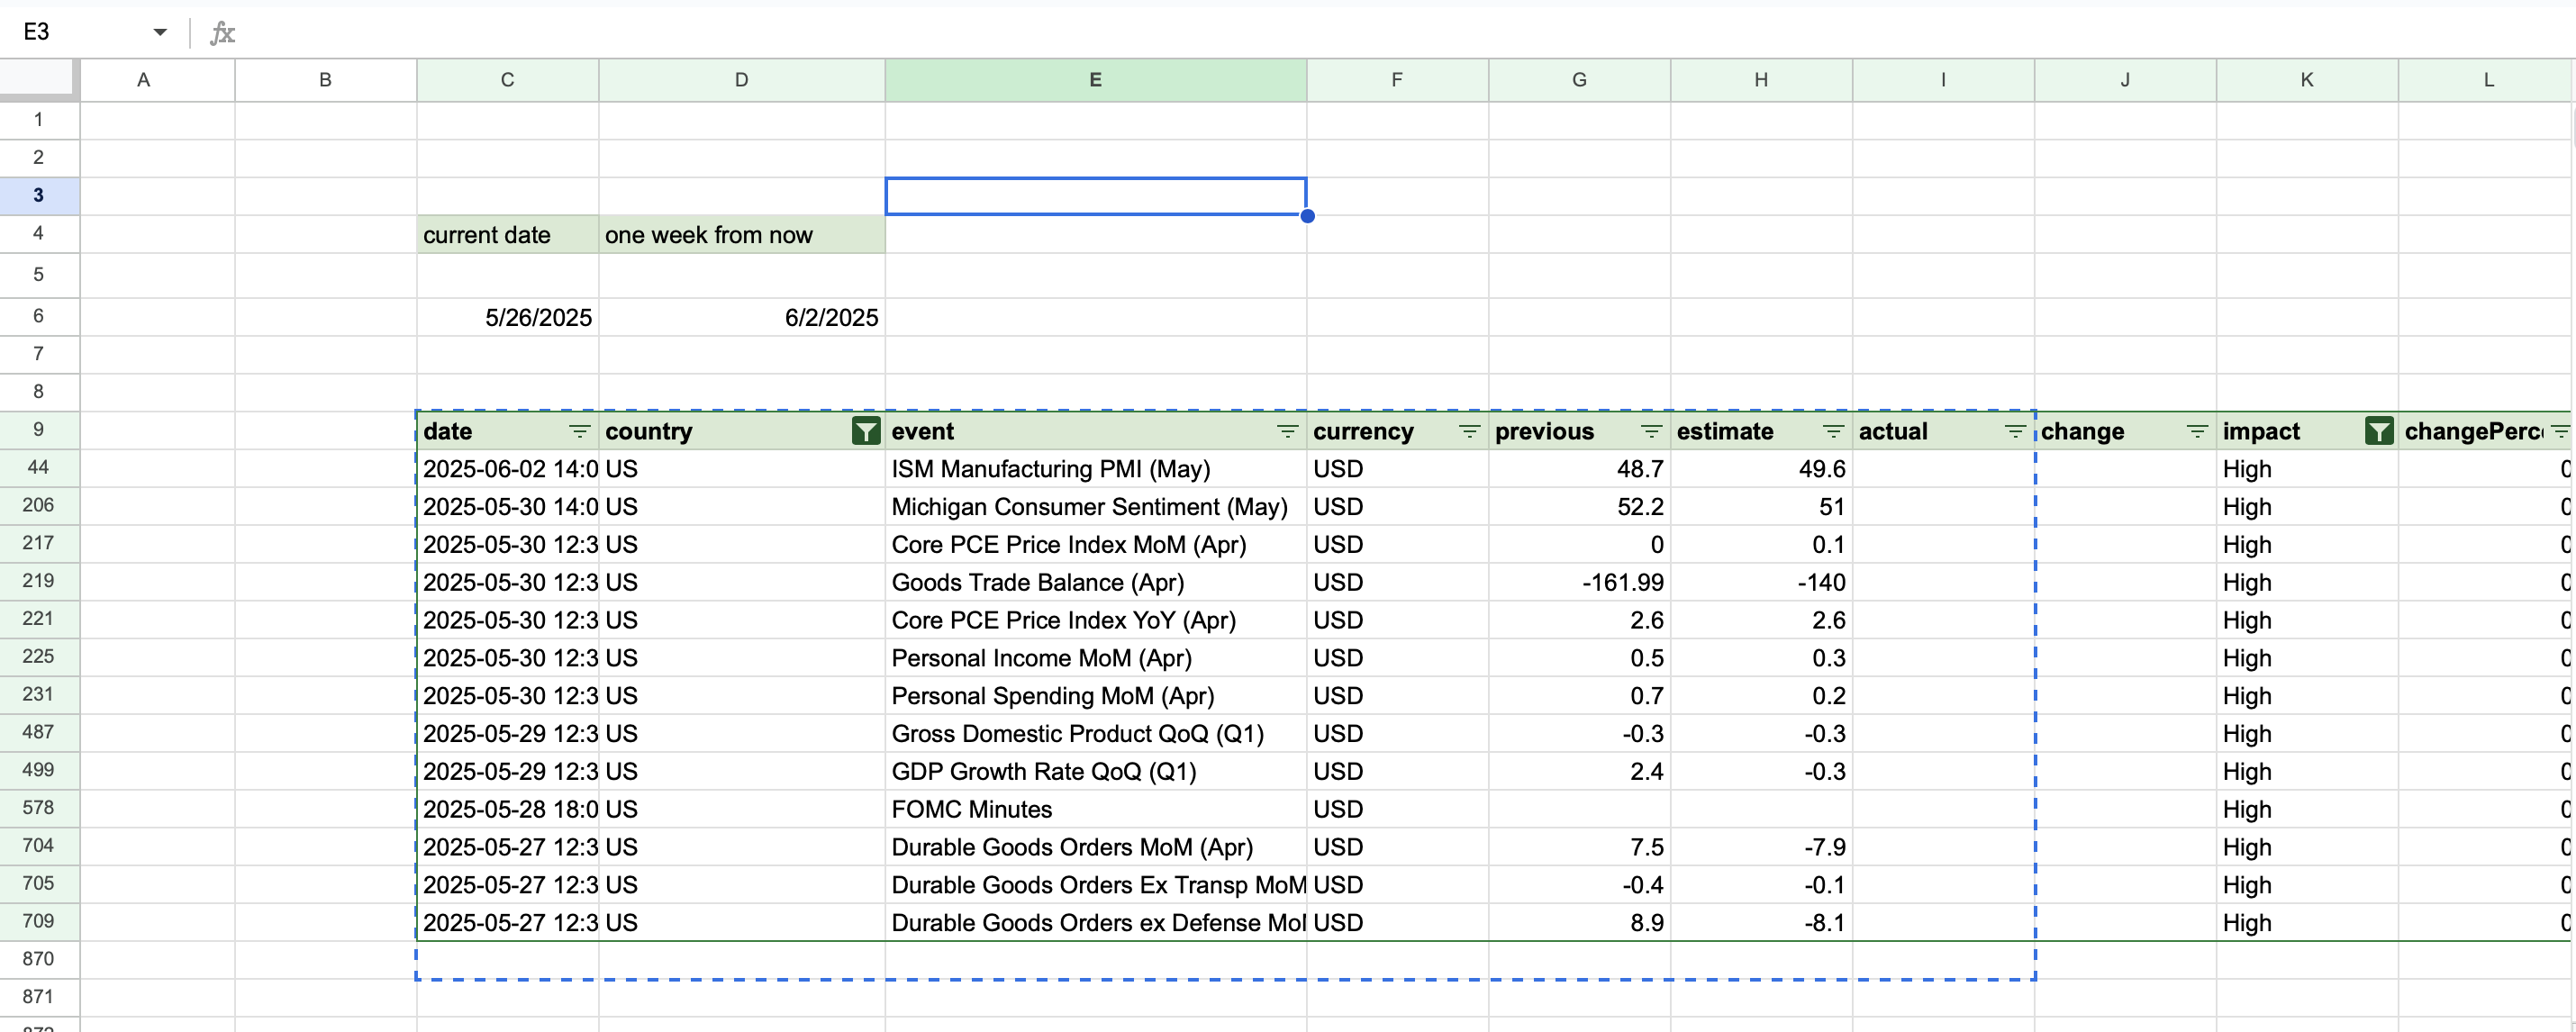
The next step is to add a calendar itself. For that, put the following formula to the empty cell, =fmpEconomicCalendar(C6,D6), where C6 is the current date and D6 is the 7 days from now. After that, hit the enter button, and you will have a calendar as shown in the picture below. The calendar displays dates according to the range that you indicated, from the 26th of May to the 2nd of June, as in our example.
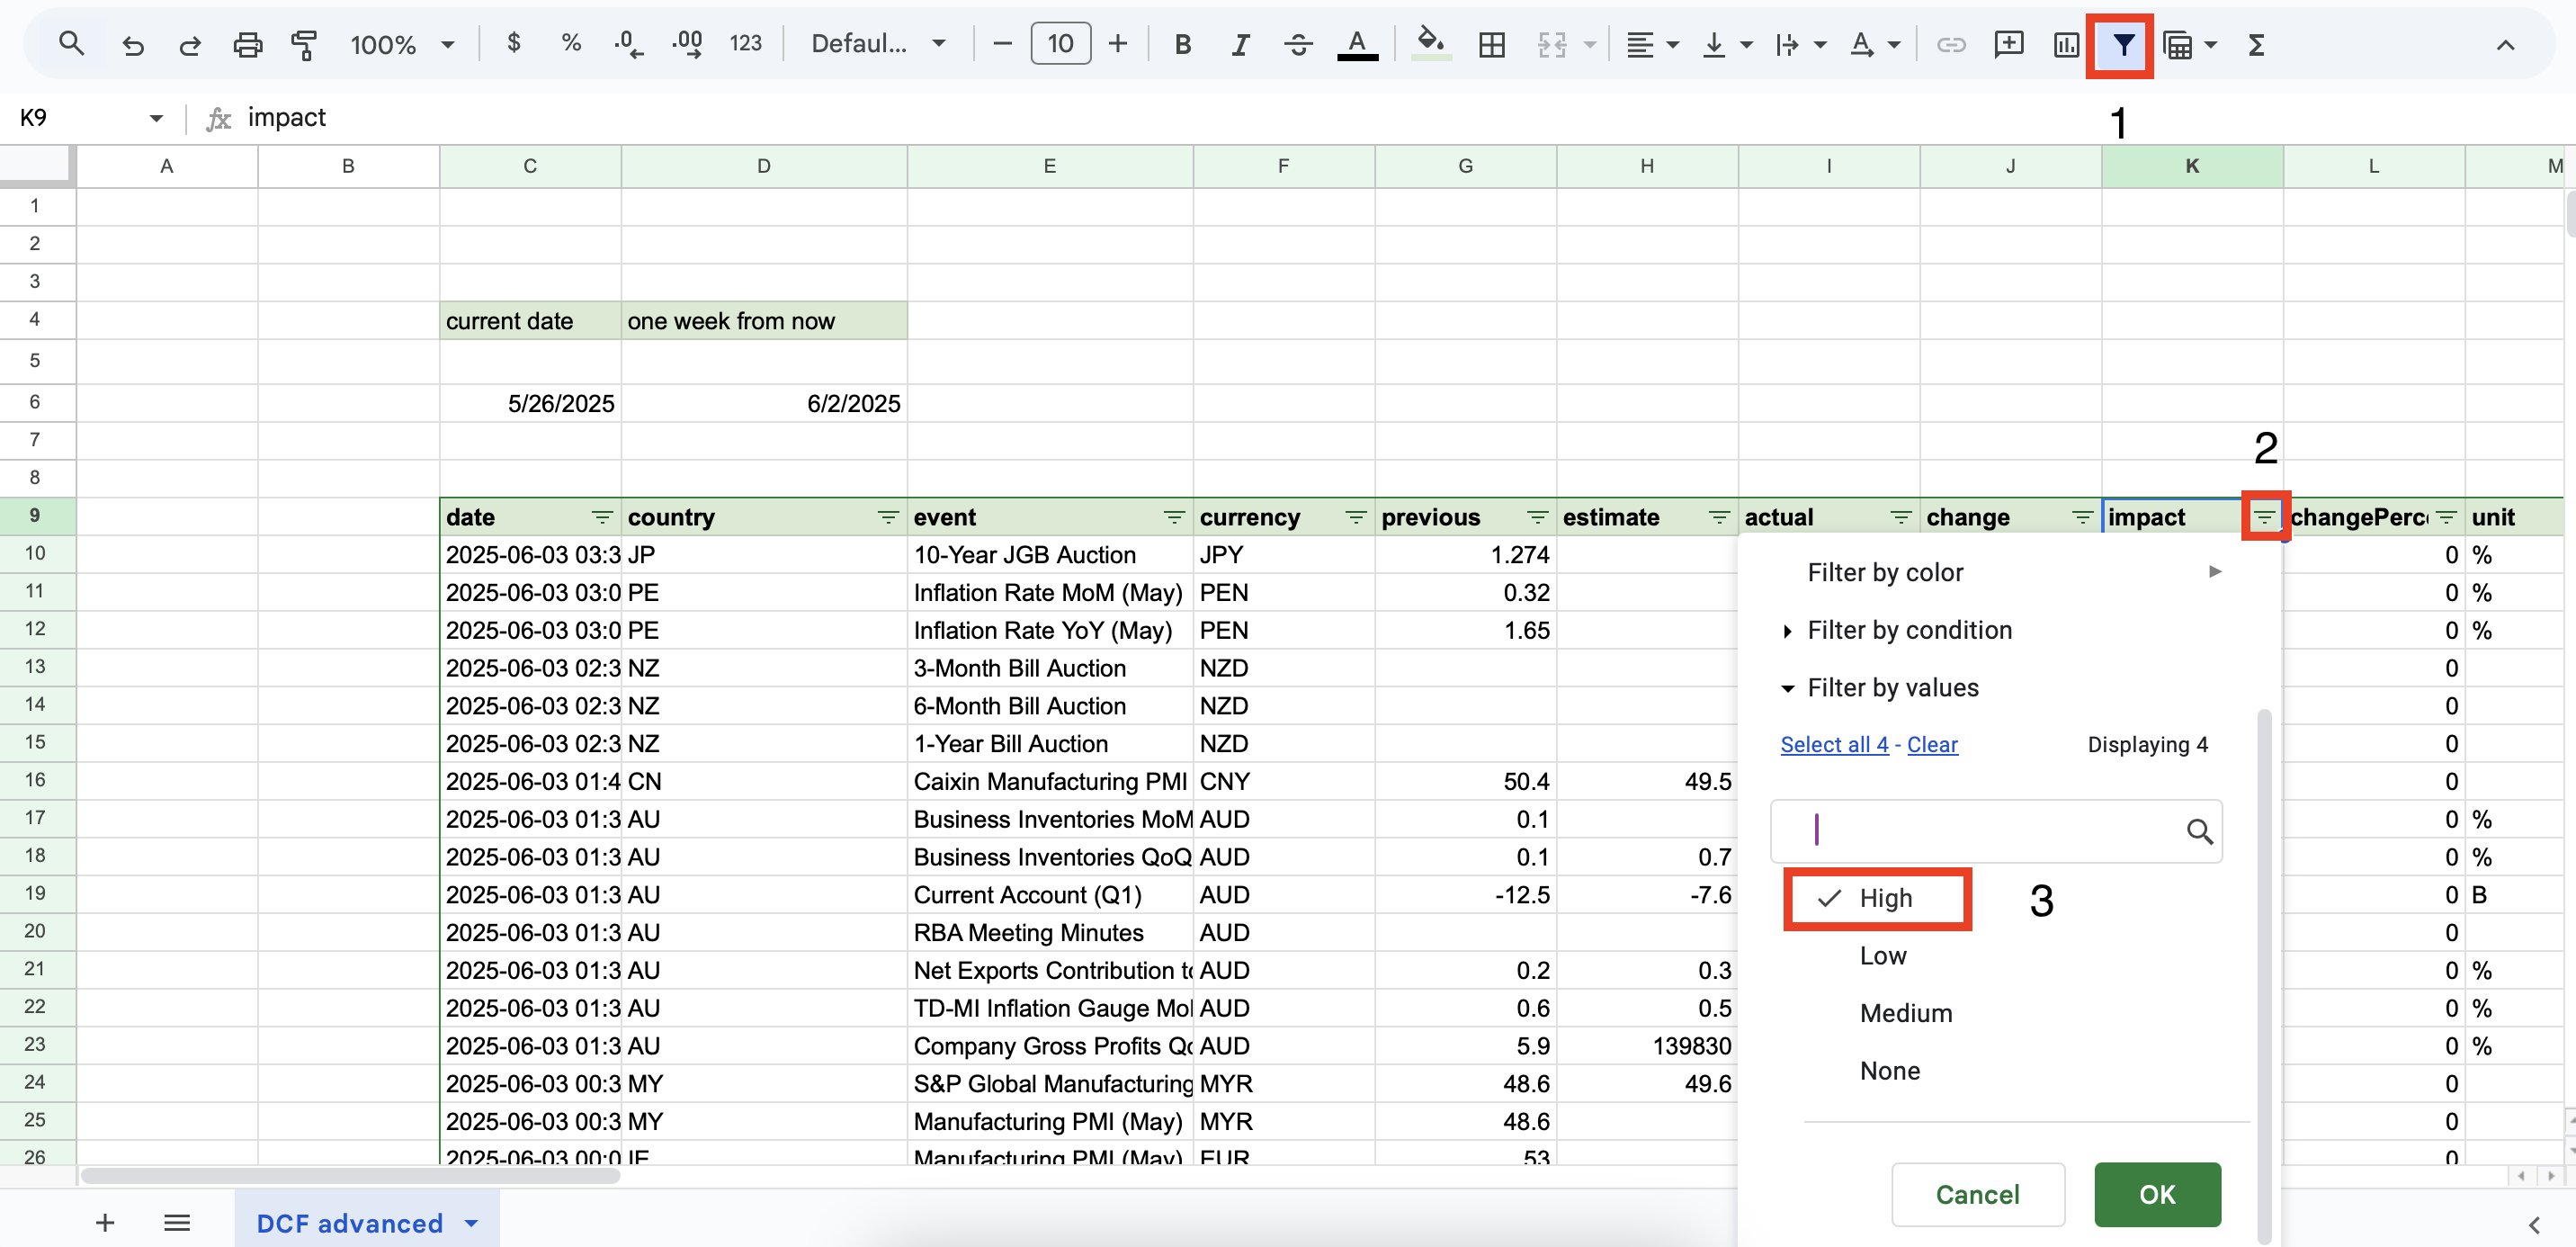
I would recommend adding a filter to sort events based on the impact, leaving high-impact events. Do the same with the country, leaving events from the country of your interest.
After applying different filtering options and extracting the weekly economic events calendar, let's see what the calendar shows us:
- SM Manufacturing PMI (May 2025): Expected at 49.6, up from 48.7, but still below 50, signaling ongoing manufacturing contraction. Bearish for industrial stocks.
- Michigan Consumer Sentiment (May 2025): Expected at 51, down from 52.2, indicating persistent consumer pessimism, potentially pressuring consumer discretionary stocks.
- Core PCE Price Index (Apr 2025): MoM expected at 0.1% (vs. 0% previous), YoY steady at 2.6%, suggesting moderating inflation but above the Fed's 2% target. Neutral for equities, slightly bearish for USD.
- Goods Trade Balance (Apr 2025): Expected to improve to -140B from -161.99B, but a wide deficit remains bearish for export-oriented stocks.
- Personal Income (0.3%) and Spending (0.2%) MoM (Apr 2025): Expected to slow from 0.5% and 0.7%, respectively, but still positive, supporting consumer stocks.
- GDP QoQ (Q1 2025): Expected at -0.3%, confirming economic contraction, but a prior 2.4% growth rate suggests some resilience. Bearish for cyclical stocks.
- FOMC Minutes (May 2025): Likely to reflect caution due to sticky inflation and mixed data, influencing rate expectations and market sentiment.
The data suggests a slowing economy with bright spots in consumer spending and selective industrial strength. I hope my explanations were clear and now you see how economic numbers and expectations can affect the stock market. Thanks for reading the article, please keep in mind that we can make assumptions and forecast share trend direction using fundamental analysis and economic indicators but no one can forecast the stock price accurately as there are many factors that come into play. But we can track investors' confidence by analysing economic indicators, actual financials and analyst assumptions and by doing so we can forecast the strength of the upcoming trend.

How an Economic Moat Provides a Competitive Advantage
Introduction In the competitive landscape of modern business, companies that consistently outperform their peers ofte...

Apple’s Slow Shift from China to India: Challenges and Geopolitical Risks
Introduction Apple (NASDAQ: AAPL) has been working to diversify its supply chain, reducing dependence on China due to...

MicroStrategy Incorporated (NASDAQ:MSTR) Earnings Preview and Bitcoin Investment Strategy
MicroStrategy Incorporated (NASDAQ:MSTR) is a prominent business intelligence company known for its software solutions a...