FMP
How to Use Technical Indicators That Work During Tariff Wars
Jun 05, 2025
US President Donald Trump's tariffs in his second administration are far more aggressive than those in his first term in office between 2016 and 2020. I compared Trump's tariffs then and now and concluded that forex traders cannot ignore factoring tariff wars into their trading strategy. This guide will walk you through how to use technical indicators to maintain profitability in unstable tariff war conditions.

What Is a Tariff War?
A tariff war is an ongoing conflict between two or more countries that begins when a country places a high tariff on certain imports, prompting the country from which the goods are being imported to retaliate with a similar tariff. Countries often get plunged into trade or tariff wars due to the perception of unfair trade practices. For instance, in the ongoing tariff war between the US and China, Trump consistently said that the US was being exploited with high tariffs from other countries.
Impact of Tariff Wars on the Forex Market
Tariff wars usually disrupt economic affairs worldwide, especially when the conflict involves world powers. Although tariff wars are mainly political, the stock and forex markets almost always react instantly to any tariff announcement.
Many forex trading accounts feature a news section to keep traders updated, but getting updates isn't enough. Knowing how to tune your trades to benefit from the volatility of tariff wars on the markets is key to staying profitable.
We will highlight three major technical indicators you can use to track the impact of tariff wars on price charts and get trading signals.
Top Three Technical Indicators To Leverage in Unstable Tariff War Conditions
Tariff wars create unique market volatility that can challenge even experienced traders. Technical indicators can provide valuable insights during these uncertain periods, but they need to be applied with specific considerations.
1. Moving Averages
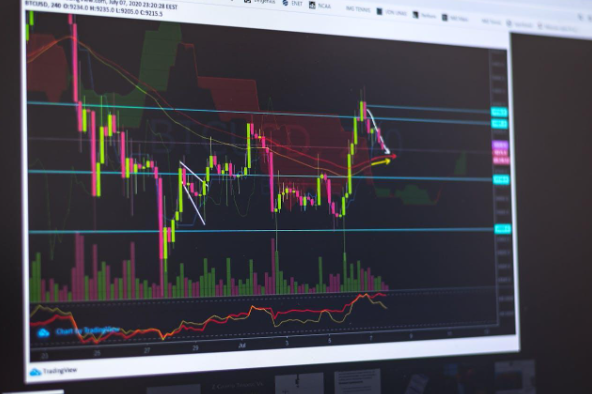
Moving Averages (MA) are trend-following indicators and are one of the most popular technical indicators in forex. News like tariff announcements can unleash sharp selling pressure on stock and forex assets. However, such price volatility is usually temporary, with the normal price momentum resuming after a while. You can understand the primary trend of an asset by using the MA, which is the average closing price for an asset over some time.
MAs come in different time frames. You'll find common ones like MA 7, MA 14, and MA 28, which represent the moving average for seven, 14, and 28 days, respectively. You can customize the duration as you like. If you're scalping, you should pay more attention to MA 7. It's short-term and shows the best opportunities for quick entries or exits. Here's what to watch out for: when the MA 7 crosses the MA 14 and MA 28, it signals a strong uptrend, indicating a good buying opportunity. However, if you observe the charts and discover that MA 7 is below MA 14 and MA 28, it means a strong downtrend, and you can focus on setting sniper entries at sell zones.
Sometimes, the MA 7 may cross below the MA 14 but not the MA 28. In this instance, you should take a more cautious approach as a reversal may be about to happen, or it might just be a short-term dip while higher time frames maintain a bullish outlook. But if the MAs are crossing over one another haphazardly, as might happen in a tariff war event, I usually take a step back. This is because such haphazard crossovers usually mean indecision in the market, and it's unclear where the market might head. It's safer to wait for a clear trend in the MA indicators.
2. Relative Strength Index (RSI)
RSI factors in all emotion-driven trading and market sentiments by investors. During a tariff war, each new import tax update may prompt investors to sell a particular currency or buy more of another currency. Using the RSI, you can note regions that have been overbought or oversold. Here's a simple principle: when the RSI is over 70, the asset is overbought, and you can look for sell entries, but if the RSI is below 30, it means the asset is oversold and has more buy entries. Regardless of the RSI, I always establish the main trend on higher time frames to inform trades I'm taking in lower frames.
You can sometimes notice the RSI making lower highs while the price is trending higher. This is a typical bearish divergence scenario, and it suggests that the bullish trend is fading. The same goes for the price if it keeps reaching lower lows while the RSI maintains higher lows. It means a bullish divergence is happening, signaling an upcoming trend reversal.
I always advise against using RSI as a sole indicator for technical analysis. Instead, it can be used in addition to price action and other technical indicators to confirm a trend.
3. Fibonacci Retracement
Fibonacci retracement is one of many traders' favorites due to its ability to capture reversal zones. The indicator is based on some Fibonacci ratios, which measure how far the price can rise or dip before retracing. The popularly used Fibonacci levels include 38.2%, 50%, and 61.8%.
To use the fib retracement, find the swing high and low. This is the highest and lowest point in the duration of a price trend you're considering. Let's say you want to trade the USD/CNH during a heated week of successive tariffs and retaliatory tariff war between the US and China.
Imagine the US announces an increase in tariffs on China's semiconductors by 50%. The USD/CNH currency then surges in response. Wait for a pullback, then place the fib retracement on the swing low to the swing high of the move. Place your entries at the 38.2%, 50%, and 61.8% zones. The price finds support in these zones and continues in its initial trend.
Use Technical Indicators to Your Advantage During Tariff Wars
Economic events will continue to impact the forex market, whether tariff wars or political conflicts. As a trader, knowing how to leverage technical indicators, especially the moving averages, relative strength index, and Fibonacci retracement, is key to staying in volatile markets. Remember to use tight stop-losses, especially when volatility surges. Price alerts can come in handy when you're gunning for sniper entries, but overall, avoid chasing the news, and the chart confirms the move.

Top 5 Defense Stocks to Watch during a Geopolitical Tension
In times of rising geopolitical tension or outright conflict, defense stocks often outperform the broader market as gove...

Circle-Coinbase Partnership in Focus as USDC Drives Revenue Surge
As Circle Internet (NYSE:CRCL) gains attention following its recent public listing, investors are increasingly scrutiniz...

LVMH Moët Hennessy Louis Vuitton (OTC:LVMUY) Financial Performance Analysis
LVMH Moët Hennessy Louis Vuitton (OTC:LVMUY) is a global leader in luxury goods, offering high-quality products across f...

