FMP
Scenario‑Planning Dashboards with FMP Macro Data: A Strategic Guide for Finance Executives
Jul 31, 2025
The global economy is a moving target—rising inflation, shifting central bank policies, and geopolitical shocks all impact business conditions in real time. For finance leaders, traditional planning cycles are no longer enough.
Scenario planning with real-time macroeconomic data enables proactive, data-backed decisions. And Financial Modeling Prep's Economic API brings those insights directly into your workflow—without requiring technical skills.
In this guide, you'll learn how to:
- Access key macro indicators in minutes
- Build dynamic dashboards using tools like Excel and Power BI
- Present scenarios with clarity and strategic impact
- Drive alignment and action at the executive level
How Real-Time Macro Data Elevates Finance as a Strategic Function
Scenario planning isn't just about anticipating risk—it's about operationalizing foresight. By integrating live macroeconomic data into forecasting workflows, finance leaders can shift from reactive planning to proactive strategy.
The result: faster decisions, tighter alignment across the business, and a stronger voice in the boardroom.
Use Economic Signals to Drive Business Moves
Macroeconomic shifts aren't just environmental noise—they're levers for decision-making. With FMP's Economic API, finance leaders can monitor GDP, CPI, and unemployment in real time and translate changes into strategic moves: adjust pricing, pause expansion, or reallocate capital with precision.
Plan from the Outside-In
Traditional forecasts begin with internal assumptions. A macro-first approach starts with the world outside your walls. When inflation accelerates or growth contracts, you model scenarios based on real signals—protecting margins, managing risk, and preparing countermeasures before conditions hit your balance sheet.
Command the Room with Data-Backed Scenarios
Executives don't want speculation—they want clarity under pressure. Dashboards built on live economic data let you present scenarios with confidence: “If CPI exceeds 4%, here's our exposure and here's our response.” It transforms the finance function from a reporting center to a strategic engine.
Powering Your Dashboard with FMP's Real-Time Economic Data
The Economic Indicators API provides instant access to critical macroeconomic indicators, including:
- GDP (Gross Domestic Product): Measures economic growth and health.
- CPI (Consumer Price Index): Tracks inflation and purchasing power.
- Unemployment Rates: Reflects labor market conditions.
- Federal Funds Rate: Indicates monetary policy and borrowing costs.
This API delivers both real-time and historical data, making it easy to plug into Excel, Python, or BI platforms like Tableau and Power BI. You can model scenarios such as:
- A sudden spike in inflation.
- A GDP slowdown signaling a recession.
- A labor market recovery or decline.
Access to timely data empowers you to respond to economic volatility with confidence and agility.
Seamless Integration
Whether you're analyzing trends in Python, forecasting in Excel, or building dashboards in Power BI, the Economic Indicators API fits smoothly into your workflow. Its flexible JSON format and simple endpoints minimize friction - even for non-developers.
Expert Tip: Use the built-in API viewer to preview responses and export data instantly. For a code-free experience, explore no-code tools that support real-time API integrations without needing custom scripts.
Real-World Use Cases
- Inflation Spikes: Rising CPI may prompt pricing strategy shifts or supply chain reassessments.
- Recession Signals: Slowing GDP combined with higher unemployment could lead to tighter budgeting or more defensive portfolio allocations.
- Labor Market Shifts: Improving payrolls and declining unemployment might support hiring or training initiatives.
Looking Ahead: The Economic Calendar API
For forward-looking insight, the Economic Calendar API provides a schedule of upcoming events—such as central bank meetings or jobs reports—so you can anticipate market-moving changes before they happen.
Want to See It in Action?
Check out our Medium article on building real-time dashboards in Python with FMP and Plotly. It walks through how to turn FMP's macro data into a live visual experience.
Transforming Macro Data into Strategic Scenarios: From Insights to Action
The FMP Economic API delivers a robust foundation of dynamic scenario planning. Key categories include:
GDP Metrics
- Real GDP: Inflation-adjusted economic growth
- Nominal GDP: Total economic output
- GDP per Capita: Economic output per person
Inflation & Interest Rates
- CPI & InflationRate: Monitor consumer prices and inflation trends
- Federal Funds Rate: Track shifts in monetary policy
Consumer Behavior
- Consumer Sentiment: Confidence in spending
- Retail Sales: Near-term demand patterns
- Durable Goods Orders: Long-term investment outlook
Labor Market
- Unemployment Rate: Labor force utilization
- Total Nonfarm Payroll: Monthly job creation
- Initial Jobless Claims: Early recession indicator
Production & Output
- Industrial Production Index: Factory and utility output
These real-time indicators form the foundation for data-driven scenario modeling—turning raw macro data into strategic insight.
Mapping Macro Indicators to Strategic Scenarios
Bridging the gap between data and action begins with linking key indicators to specific economic conditions. Here's how finance leaders can apply this framework:
- Recession Scenario: A drop in Real GDP alongside rising Unemployment Rate and Initial Claims points to a downturn. Strategic actions may include cutting operational costs, preserving liquidity, and shifting capital to defensive positions such as bonds or cash.
- Inflationary Scenario: A spike in CPI and Inflation Rate, paired with stagnant GDP, signals rising costs without corresponding growth. Tactics may involve price adjustments to protect margins, supply chain diversification, and hedging against currency volatility.
- Growth Scenario: Rising GDP, declining Unemployment Rate, and strong Retail Sales and Durable Goods Orders suggest expansion. This creates opportunities to scale production, invest in workforce growth, and pursue new market entry.
By mapping macro indicators to specific strategic responses, you can ensure that scenario planning is not just analytical—but operationally actionable.
From Data to Dashboard: Setting Up Your Scenario Toolkit
FMP makes economic data accessible at the executive level—no technical setup needed. This section shows you how to quickly access and organize macroeconomic indicators like GDP, CPI, and unemployment—then use them in tools you already know, like Excel, Power BI, or Google Sheets.
Step 1: Get Economic Data from FMP
- Register for an API Key
Go to Financial Modeling Prep and sign up to get your unique API key—this is your personal access code for data. - Choose Your Economic Indicators
You can retrieve dozens of key indicators, including: - GDP - Economic growth
- CPI - Inflation
- Unemployment Rate - Labor market strength
- Federal Funds Rate - Interest rate trends
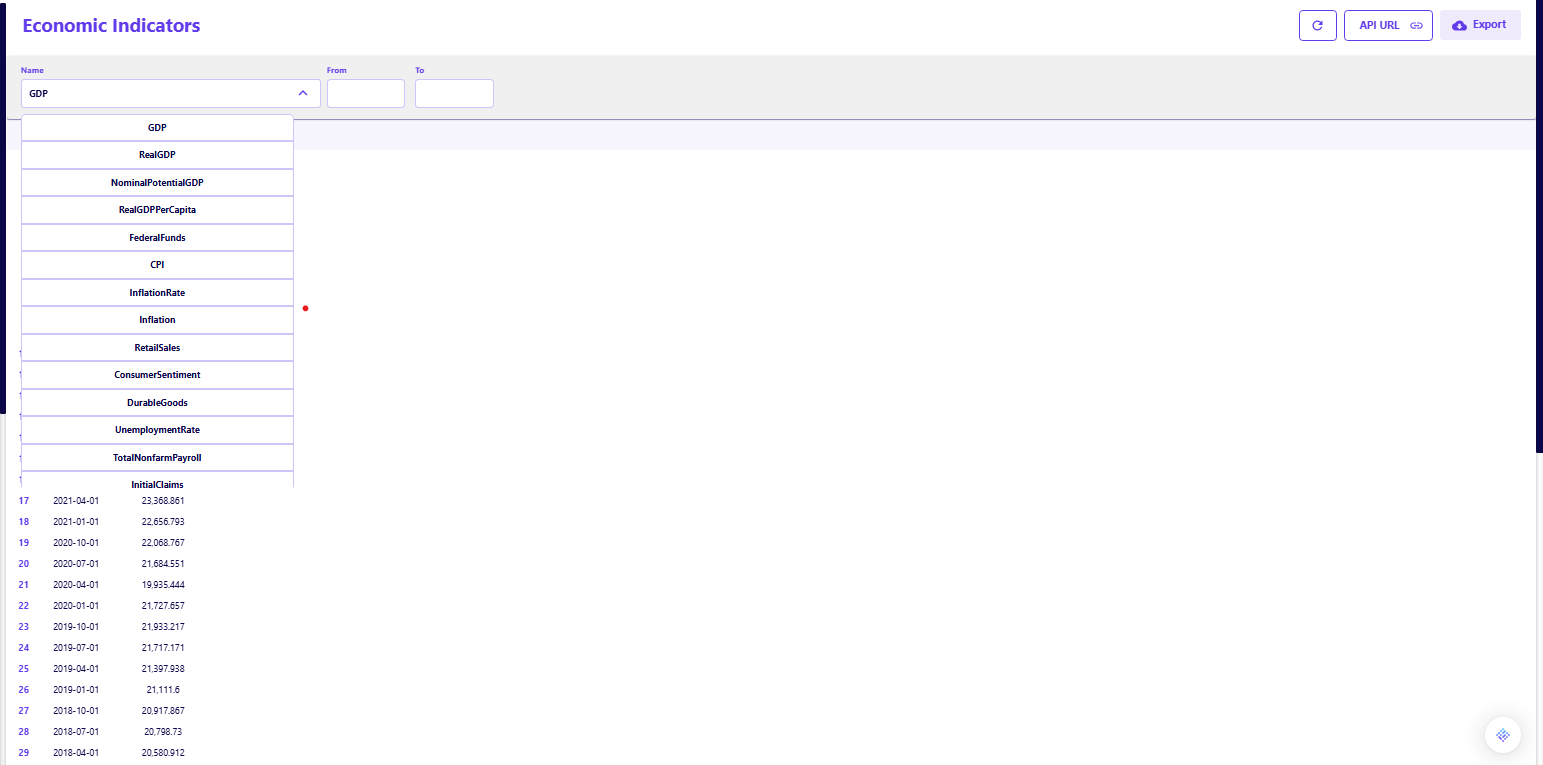
- Preview the Data Without Coding
Use the API Viewer Tool on the FMP website to try out indicators without writing any code. Simply: - Select an indicator (like GDP)
- Set a date range (max 90 days at a time)
- Click Run to see the results
- Export as CSV or copy the values into Excel
You can repeat this process for multiple indicators and combine the files later.
Troubleshooting Tip:
If your data preview returns an error or shows no results, double-check that:
- Your API key is correctly pasted and has not expired.
- The indicator name (e.g., GDP, CPI) is spelled exactly as listed in FMP's documentation.
- Your date range does not exceed the 90-day limit.
Not sure how to fix it? Ask your analyst or IT team to test the link using the API Viewer on the FMP site—it's often the fastest way to pinpoint the issue.
Step 2: Organize the Data in Excel or Sheets
Once you've downloaded your data:
- Open each CSV file in Excel or Google Sheets
- Standardize the Date Column
Make sure all datasets use the same date format—preferably YYYY-MM-DD. - Align the Frequency
Choose a monthly or quarterly view depending on your planning horizon. - Combine the Data
Copy and paste the different indicator files into one master sheet, aligned by date.
Your result will be a simple table like this:
|
Date |
GDP |
CPI |
Unemployment |
|
2025-01-01 |
22,000.5 |
3.4% |
4.1% |
|
2025-02-01 |
22,100.8 |
3.5% |
4.0% |
Once you have this, you're ready to visualize trends.
Step 3: Build Your Dashboard
Now it's time to turn your dataset into insights.
Choose Your Tool:
- Excel: Quick and familiar for most teams
- Power BI / Tableau: Best for interactive, executive-ready visuals
- Google Sheets: Ideal for collaborative work across teams
Suggested Visuals:
- Line Chart for GDP trends over time
- Bar Chart for changes in inflation (CPI)
- Area Chart to track unemployment rate
Add Interactivity:
- Use filters or dropdowns to compare scenarios, time ranges, or indicators
- Limit the view to 3-5 key metrics to keep it clean and focused
Bringing It All Together
In just three steps—accessing data, organizing it in a spreadsheet, and visualizing it with familiar tools—you can build a macroeconomic scenario dashboard without writing a single line of code. This gives you real-time visibility into economic trends and a powerful toolkit for strategic decision-making.
From Dashboard to Decision: Presenting Scenarios That Drive Action
A dashboard is only as valuable as the story it tells. To turn data into decisions, finance leaders must present macroeconomic scenarios in a way that's clear, strategic, and compelling.
Set the Stage
Start with a big-picture slide that frames the conversation. For example:
“Q4 2023 Macro Outlook: Navigating Inflation and Growth”
Include a snapshot from the FMP Economic API—e.g., “GDP at 1.8%, CPI up 3.2%.”
Use exported visuals or static charts from your dashboard to anchor the discussion in real-time data.
Model Strategic Scenarios
After setting the context, walk the team through three plausible economic paths—each tied to specific business decisions.
Scenario 1: Stable Growth
- Conditions: CPI at 3%, GDP +2%
- Implication: The environment is steady. No major changes needed.
- Strategy: Maintain operations and continue existing investment plans.
Scenario 2: Inflation Crunch
- Conditions: CPI at 5%, GDP flat
- Implication: Rising input costs with stagnant growth puts margins at risk.
- Strategy: Cut discretionary spending, renegotiate supplier contracts, and consider modest price increases.
Scenario 3: Recession Risk
- Conditions: GDP -1%, production contracts
- Implication: Demand slows, creating potential revenue shortfalls.
- Strategy: Shift to lean inventory, delay capital expenditures, and pause hiring.
Visual Snapshot: Scenario Summary Table
|
Scenario |
CPI |
GDP |
Strategic Response |
|
Stable Growth |
3% |
+2% |
Maintain operations and current investments |
|
Inflation Crunch |
5% |
0% |
Cut discretionary spend, renegotiate contracts |
|
Recession Risk |
- |
-1% |
Lean inventory, delay capex, pause hiring |
Use this table to support your presentation slides or executive handouts. It distills complex planning into an easily digestible format.
Tie Data to Decisions
Close with an Action Slide that clearly links data to strategic recommendations. For example:
“If CPI exceeds 4%, raise prices 2% to protect margins.”
Keep this section brief and focused—3 to 5 bullet points is ideal. Align each recommendation to a modeled scenario.
Real-World Use Case: Equipping a CFO for Real-Time Planning
The Scenario:
Sarah, CFO of a mid-sized manufacturer, is under pressure. Inflation is rising, supply chain costs are up, and the board wants a revised 2024 budget that accounts for multiple economic outcomes.
Historically, her team took weeks pulling data from government reports and stitching it together in Excel—a process too slow for today's volatility.
The Solution:
Using the FMP Economic API, Sarah's team connects CPI, GDP, and Industrial Production data into a Power BI dashboard. Within days, they model three scenarios:
- Stable Growth: CPI at 3%, GDP +2% → Maintain operations
- Inflation Crunch: CPI at 5%, GDP flat → Cut discretionary spend, and renegotiate contracts
- Recession Risk: GDP -1%, output down → Shift to lean inventory, delay capex
The Presentation:
In the boardroom, Sarah increases CPI in her dashboard from 3% to 4%—revealing an immediate 4% margin risk if no action is taken. She states to the room:
“Based on this scenario, here's the recommended course of action.”
The board approves her hybrid strategy: adjust pricing now, with contingency plans ready.
The Outcome:
Sarah's leadership—powered by real-time data—moves the company from reactive to ready.
This Isn't Just About Dashboards—It's About Strategic Finance Leadership
Scenario planning with the FMP Economic API empowers finance leaders to move beyond reporting and into forward-looking strategy. When you can link real-time insights to concrete action, you position yourself as a trusted partner in guiding the business.
Lead with Insight, Not Just Numbers
In an era of economic uncertainty, dynamic dashboards powered by live macro data are essential. With Financial Modeling Prep's Economic API and Economic Calendar, your finance team can turn real-time data into strategic narratives that inform, align, and drive action.
Get your free API key. Build your first dashboard. And lead with confidence.
FAQs
What is the FMP Economic API?
The FMP Economic API provides real-time macroeconomic data—including GDP, CPI, unemployment, and more—across multiple countries. It enables seamless integration into dashboards and forecasting tools without requiring complex development.
Why should finance teams use scenario planning?
Scenario planning equips finance leaders to proactively prepare for economic uncertainty. It enhances budgeting accuracy, improves risk management, and enables more agile, data-driven decision-making.
What tools are best for dashboard building?
- Excel - Ideal for quick analysis and familiar workflows
- Power BI / Tableau - Best for interactive, executive-level visualizations
- Google Sheets - Great for collaborative, cloud-based updates across teams
How can I get started with the FMP API?
Get started with Financial Modeling Prep by signing up for an API key. You can use the API Viewer to preview data and follow simple documentation to begin.
Can I automate updates in my dashboard?
Yes. You can schedule API calls to keep your data refreshed automatically—ensuring your dashboards always reflect the latest economic conditions.
How does this help in executive meetings?
It equips finance leaders with credible, real-time data to support fast, confident decisions. Instead of speculation, you present clear, scenario-based insights backed by live economic signals.

MicroStrategy Incorporated (NASDAQ:MSTR) Earnings Preview and Bitcoin Investment Strategy
MicroStrategy Incorporated (NASDAQ:MSTR) is a prominent business intelligence company known for its software solutions a...

WACC vs ROIC: Evaluating Capital Efficiency and Value Creation
Introduction In corporate finance, assessing how effectively a company utilizes its capital is crucial. Two key metri...

BofA Sees AI Capex Boom in 2025, Backs Nvidia and Broadcom
Bank of America analysts reiterated a bullish outlook on data center and artificial intelligence capital expenditures fo...

