FMP
Which Financial Modeling Prep Data Should You Start With?
Jan 08, 2026
Overwhelmed by data options? You're not alone. Financial Modeling Prep (FMP) offers over a dozen data categories - from real-time stock prices to economic indicators - and hundreds of endpoints.
The paradox of choice can lead to analysis paralysis, where having too many options makes it harder to decide. The good news: you can cut through the noise by zeroing in on your goal. Whether you're a developer building a finance app or an analyst starting a research project, choosing the right data category as your starting point will save time and keep you focused.
This article provides a clear decision framework to help you pick an FMP dataset aligned with your objectives, so you can start your financial data journey with confidence.
Too Many Options? The Data Choice Overload
With FMP's comprehensive data coverage, it's easy to feel inundated. The platform provides an extensive range of financial data - including real-time stock quotes, historical prices, company fundamentals, forex and crypto data, and even economic indicators.
In fact, FMP spans 17+ data categories, covering everything from earnings call transcripts to ESG metrics. This breadth is a strength, ensuring financial data for every need, but it also means newcomers face a daunting first question: where to begin?
Psychologists call this choice overload - when people get overwhelmed by too many options. Instead of diving into analysis, you might find yourself browsing endpoint documentation endlessly. The key to overcoming this is focus. Rather than trying to sample a bit of everything, start with the one data category that best matches your immediate goal. By narrowing scope, you'll reduce decision fatigue and quickly gain useful insights, building momentum for deeper exploration later.
How do you identify that starting point?
Ask yourself what you're trying to achieve first. Are you researching a specific company's health? Monitoring market moves in real time? Or assessing the macroeconomic backdrop?
Each goal aligns with a different FMP dataset. In the sections below, we'll map common goals to the ideal starting data category, explain why that category is the best fit, and highlight what you can do with it. This way, you can kick off your FMP experience with purpose and avoid drowning in options.
Match Your Data to Your Goal
Not all financial data is created equal. The best dataset to begin with depends on what question you're trying to answer or what project you have in mind. Let's break down three common goals:
- company research
- market monitoring
- macro analysis
and let's see which FMP data category makes the most sense to start with for each. By aligning data selection to your goal, you'll get relevant insights faster and set a solid foundation for later expansion.
1. If You're Researching a Company: Start with Fundamentals and Profiles
|
Goal: You want to analyze a specific company in depth - understand its business, financial health, and performance drivers. This is common for equity analysts, investors, or developers building stock research tools. |
Start with the Fundamental & Company Data category.
In particular, FMP's Company Profile API and Financial Statements API will be your best starting points.
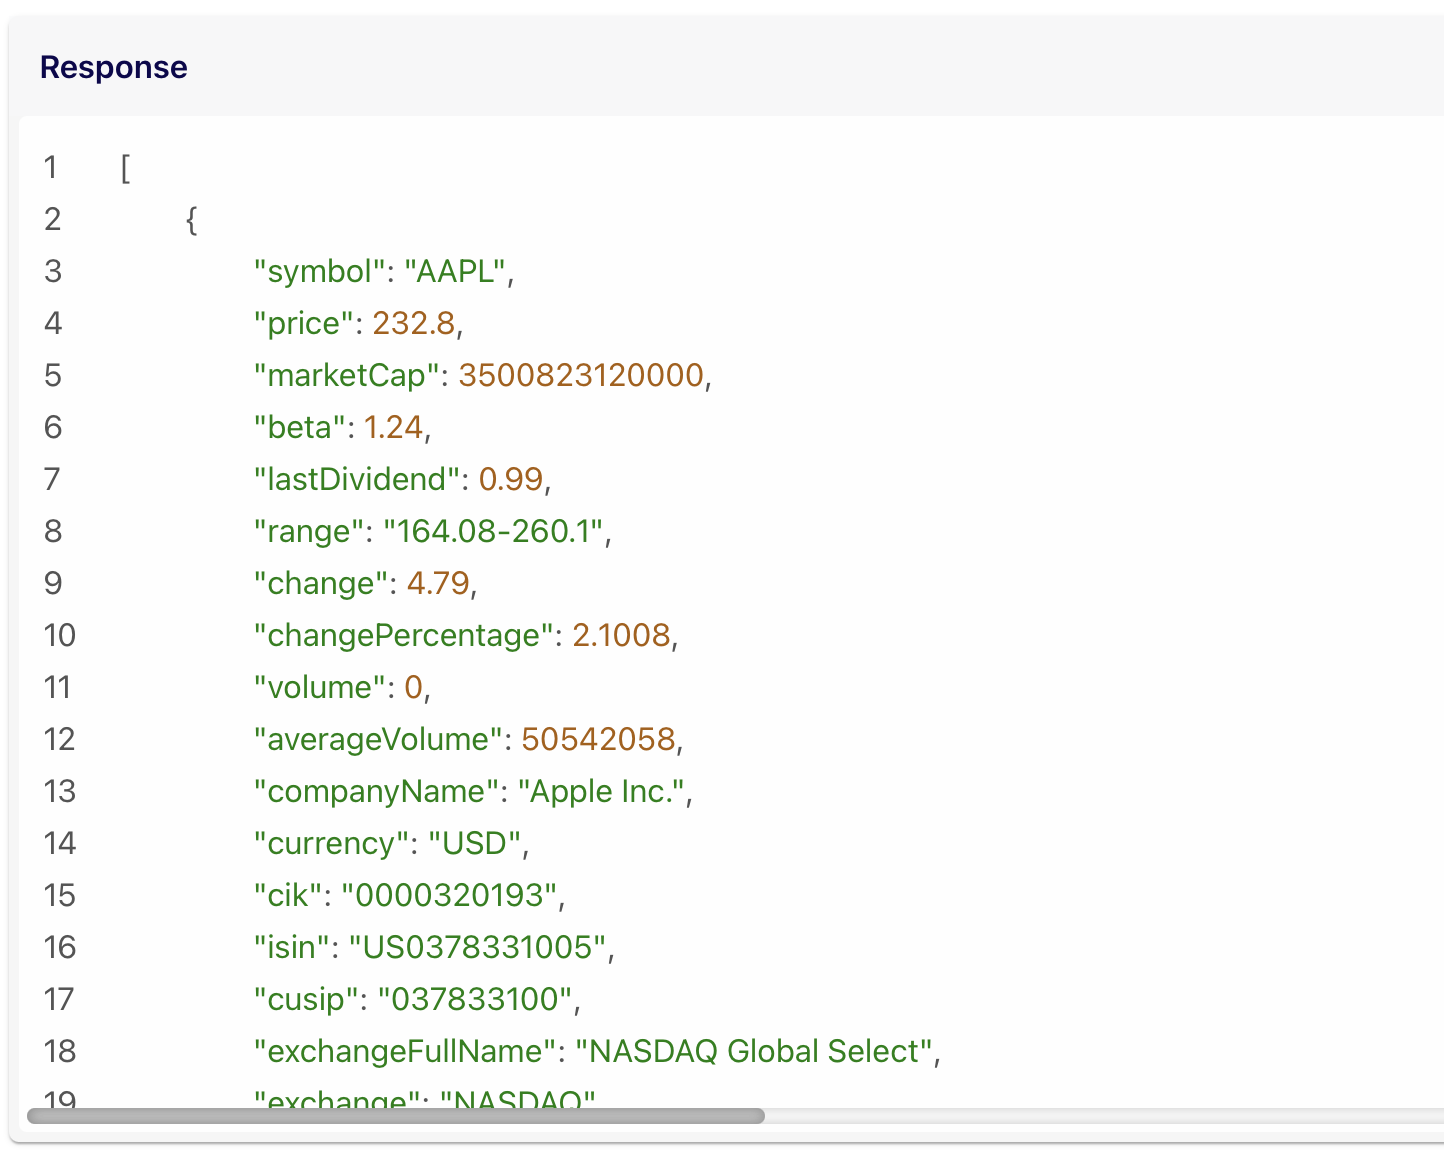
The Company Profile API gives a quick yet comprehensive snapshot of a firm, including its business summary and key operational and financial info (sector, CEO, market cap, stock price, etc.). It's an ideal way to grab core facts and context about your target company.
For instance, with a single query you can retrieve a company's market capitalization, industry classification, headquarters location, and even recent stock price in one go. An investor could pull Apple Inc.'s profile to see its industry, and key metrics at a glance, helping inform a first impression.
Company Profile API Endpoint
Meanwhile, the Financial Statements API unlocks the deeper fundamental data - audited income statements, balance sheets, cash flows, and key financial ratios. FMP's fundamental APIs provide detailed financials (annual, quarterly, and trailing-twelve-month) via developer-friendly endpoints.
This dataset is perfect if you need to dive into revenue, profits, debts, and other fundamentals to evaluate a company's performance over time.
|
For example, you can fetch 10+ years of financial history for a company and use it to calculate trends in revenue growth or profitability. |
Analysts use this data to build valuation models, run forecasts, and compare companies side by side. It's the backbone for any thorough company analysis.
By starting with fundamentals and profiles, you focus on quality of information over quantity. These data sets directly answer “What does this company do and how is it doing financially?” - which is likely your primary question.
|
Tradeoff: Fundamental data isn't as instant or constantly changing as market prices; financial statements update quarterly, and profiles won't tell you today's stock swing. But that's fine, because for research the value is in vetted, detailed information. You get a solid foundation of facts that you can trust. In FMP's ecosystem, this approach is so central that third-party reviewers dub FMP “the fundamentals king” for its depth in this area. |
These APIs are an ideal first step for company research, and you can access them with a free API key. Sign up on FMP to get started and query these endpoints with live data.
For more hands-on walkthroughs, the FMP blog is a great companion to this framework - start with these two:
- Build your market data foundation with FMP: five guides to help you get started
- How to analyze a company using financial ratios and the Financial Modeling Prep API
2. If You're Monitoring the Market: Start with Real-Time Market Data
|
Goal: You need to track market movements in the moment - perhaps building a live dashboard, a trading signal, or just keeping an eye on prices and trends. This applies to developers making trading apps, quants running algorithms, or finance professionals who need the pulse of the market. |
Start with the Real-Time Market Data APIs.
FMP's real-time data feeds provide tick-level quotes and updates across assets - stocks, indices, ETFs, forex pairs, cryptocurrencies, commodities, you name it. If your priority is immediacy and breadth of market coverage, this is the go-to category.
You can stream live stock prices and see how they change second by second, enabling you to react swiftly to news or price swings. For example, the Stock Quote API returns the latest price, volume, and change for any given ticker (or even a batch of tickers) in real time.
Stock Quote API Endpoint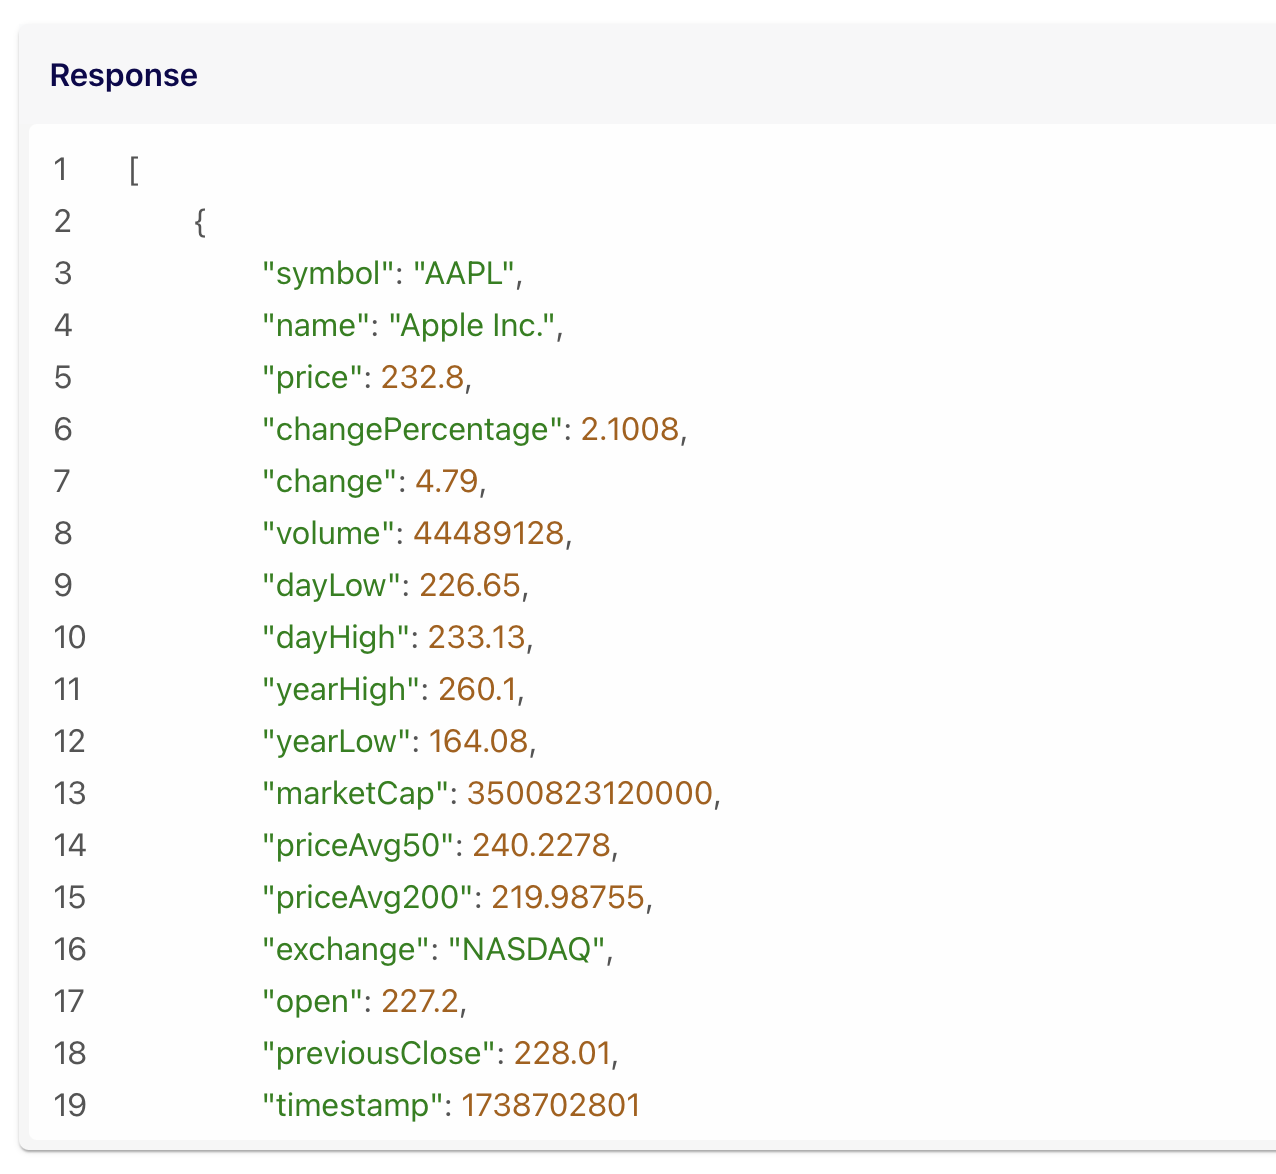
With one call you might get Apple at $232.8 +2%, Microsoft at $250 -1%, etc., updated to the last trade - exactly the info needed for a trading dashboard or alert system.
Real-time APIs are built for speed and coverage. They offer “global, multi-asset coverage” with low-latency delivery.
You can monitor the S&P 500 index, a set of tech stocks, forex rates, and even crypto prices all through one service. This is hugely beneficial for market monitoring tools that need everything in sync.
In practice, a developer could use FMP's batch quote endpoint to refresh prices for a watchlist of 50 stocks in a single API call, updating a UI widget every few seconds. The data is delivered in JSON and is easy to integrate, whether you're updating a web app or feeding an algorithm.
|
Tradeoff: real-time data gives you breadth and instantaneity, but not depth of context. You'll know what the price is right now, but not why or whether it's fundamentally justified. That's okay - for a market monitoring goal, your aim is quick decision-making. |
If you're building, say, a stock price alert system, it's more critical to have up-to-the-minute quotes than a deep fundamental analysis. Real-time APIs are also an excellent starting point because they provide immediate feedback - you call the API and see live numbers, which is rewarding and helps you rapidly prototype your application.
Once you're comfortable with streaming quotes, you can consider adding related data like Technical Indicators to enrich your market analysis. But to begin, stick to live data to avoid getting overwhelmed.
Want to see real-time data in action? Try pulling a live quote using the Stock Quote API - for example, retrieve the quote for AAPL and watch the JSON response show Apple's current price, daily high/low, and more.
Apple live stock quote
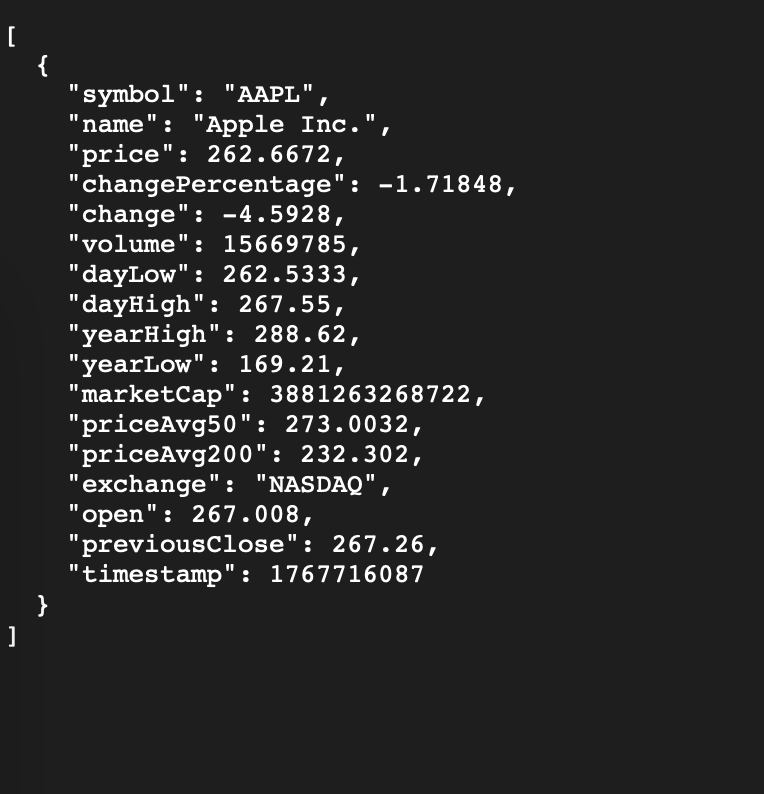
You can also use the Batch Quotes API to get several tickers at once. This is a perfect way to kickstart a market-monitoring project. With FMP's free plan you get real-time quotes for testing, so sign up and fire up the Quote API to bring real market action into your app.
If you want quick “how to use it” guide for the APIs used in the sections above, read this article:
3. If You're Analyzing Macro Trends: Start with Economics Data
|
Goal: You want to understand the big-picture environment - interest rates, inflation, economic growth - and how it might impact markets or investments. This is often the focus of macro-focused analysts, economists, or strategists. It can also be useful for investors framing their portfolio strategy against economic conditions. |
Start with the Economics Data APIs.
FMP's economics endpoints provide a rich collection of macroeconomic indicators and market-wide metrics. For example, you can fetch data on GDP growth, unemployment rates, inflation (CPI), interest rates (Treasury yields), central bank rates, and even the economic calendar of upcoming data releases.
If your goal is macro analysis, these indicators are the starting point because they quantify the health of economies and financial conditions. They answer questions like: Is the economy growing or slowing? (GDP), What's happening with inflation? (CPI), Where are interest rates headed? (Treasury yields), etc.
FMP's Economic Indicators API gives you direct access to dozens of key stats (e.g. US GDP, China GDP, US unemployment, CPI, etc.) with historical time series.
Meanwhile, the Treasury Rates API provides real-time and historical yields for various maturities (from 1-month bills to 30-year bonds) - crucial for understanding the interest rate environment.
There's also an Economic Calendar API to track scheduled releases like Fed meetings, jobs reports, CPI announcements, so you never miss an important macro event.
In short, the Economics category is a one-stop shop for macro data that can inform high-level strategy and risk assessment.
Why start here for macro analysis? Because macro data provides context that individual stock numbers can't.
|
For instance, knowing that inflation is at 5% and rising might influence whether you expect interest rates to increase (bearish for bonds, maybe mixed for stocks). Economic growth trends can signal corporate earnings prospects broadly. |
Many top-down investors and asset allocators begin their analysis by looking at these indicators to decide which markets or sectors to favor.
Figure: Example of a macro trend - Real GDP over time with recessions highlighted. Macroeconomic data like GDP can reveal the broader context for market conditions, as shown by growth dips during recession periods and post-crisis rebounds. Such charts add narrative depth to your analysis, connecting macro inflection points with market or corporate performance shifts.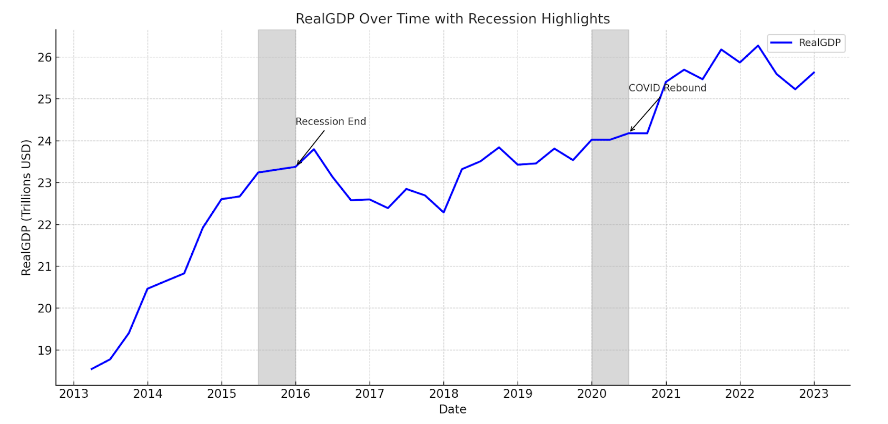
|
Tradeoff: Macro data is powerful for the big picture, but it won't tell you specifics about an individual stock. It's best used to complement other analysis. If you start with macro and stop there, you'll know the environment but not which company is a better investment. Thus, use economics data to frame your strategy (e.g. overweight sectors that do well in high-rate environments, or adjust discount rates in your valuation models). |
To learn the macro endpoints with real examples, start with these two:
- Forecasting stock market trends with the yield curve
- How to use FMP economic calendar with Google Sheets and why its important for traders
Balancing Depth and Breadth: When to Expand to New Data Categories
Picking one data category to start with doesn't mean you must ignore the rest forever. Think of it as setting a priority for learning and integration. Once you've gotten value from your primary dataset, you can broaden your analysis by incorporating other data types. The art is in knowing when and why to expand.
Each FMP category has its strengths, and they often complement each other. Here are a few insights on tradeoffs and combinations:
- Real-Time vs. Fundamental Data: Real-time market data gives you breadth and immediacy - great for short-term trading and monitoring - whereas fundamental data gives you depth and insight into a specific company. If you started with real-time quotes for a trading app, consider adding fundamental metrics once you need context (e.g. pulling P/E ratios or earnings data to filter your watchlist). Conversely, if you started with fundamentals, you might later fetch real-time prices to see how the market is reacting to those fundamentals in the moment. The two together answer both “what's happening now?” and “why does it matter?”.
- Macro Data vs. Micro Data: Macro indicators provide the backdrop for micro (company-level) analysis. If you began with macro data (say, noticing interest rates are rising), you could next incorporate company data to find which companies might be most affected (perhaps focusing on financial sector stocks, or evaluating companies' debt levels via the Financial Statements API in a high-rate environment). On the flip side, if you started with a company dive and discovered, for example, that its international sales are booming, you might pull macro data on that region's economic growth to validate sustainability. In essence, macro helps explain broad trends that micro data alone might miss.
- Use-Case-Specific Data: FMP also offers niche datasets like Insider Trading, Earnings Call Transcripts, ESG scores, and more. You don't need these at the start unless they directly align with your initial goal. But be aware of them for future needs. For example, if your focus shifts to understanding investor sentiment or governance risks, you might explore the Insider & Congressional Trading dataset or ESG Data. If you need to find investment ideas, the Search & Directory (screener) APIs can be a next step - they allow you to filter companies by criteria once you know what you're looking for. Start narrow, then go broad or specialized as your questions evolve.
Remember that adding more data sources should be driven by a new question or requirement, not by FOMO (fear of missing out on an API!). The beauty of FMP's platform is that when you're ready, all the data will be there, unified under one API ecosystem.
By beginning with the dataset that aligns to your core objective, you'll build a strong understanding in that domain, which will make integrating other data later much easier.
FAQs
What data categories are available on Financial Modeling Prep?
FMP offers a wide range of data categories covering market data, company data, and macro data. These include:
- Real-Time Market Data (live quotes for stocks, ETFs, forex, crypto, etc.).
- Historical Market Data (price history and charts).
- Financial Statements (income statements, balance sheets, cash flows)
- Company Profiles (company background info and key metrics)
- Economics Data (GDP, inflation, rates, etc.).
- Analyst Estimates & Price Targets.
- Earnings Call Transcripts.
- Market Calendars (earnings, IPOs, dividends dates).
- Form 13F (institutional holdings).
- Advanced Market Metrics (technical and quantitative indicators), and more.
I'm building a trading application - which FMP data should I start with?
For a trading or market monitoring app, start with Real-Time Market Data. This will give you live stock prices, indices, forex rates, crypto prices, etc., which are crucial for any trading strategy or reactive application. You might later incorporate Historical Market Data for charting or backtesting, but real-time data is the foundation for trading use-cases. (Example: Use FMP's stock quote endpoint to stream live prices into your app's dashboard.)
I want to analyze a company's fundamentals - where do I begin?
Begin with the Financial Statements and Company Profile data for that company. The Company Profile API will give you a quick overview of the firm - including its industry, description, market cap, and current stock price - which is great for context.
Then, pull the company's financial statements (income statement, balance sheet, cash flow) using FMP's fundamentals APIs. This combination lets you assess both the qualitative picture (what the company does, who leads it, basic metrics) and the quantitative financial picture (how it's performing financially over time).
How can I use FMP data for macroeconomic analysis?
FMP provides a dedicated Economics Data category ideal for macro analysis. You would use the Economic Indicators API to get data like GDP, inflation (CPI), unemployment rates, etc., for various countries. You can also use the Treasury Rates API for interest rates/yield curves, and the Economic Calendar API for upcoming economic events. By pulling these datasets, you can analyze trends such as economic growth cycles, inflationary periods, and interest rate changes.
Should I focus on one data category or use multiple at the start?
It's usually best to focus on one primary data category at the start, the one most aligned with your immediate goal. This prevents information overload and allows you to get comfortable with the data format and insights from that category.
For instance, if your goal is building a market monitoring tool, begin with real-time prices alone. If it's company analysis, begin with fundamentals alone. Once you gain value from that first dataset, you can gradually incorporate others as needed. Many successful projects do end up using multiple data types (for example, combining macro indicators with company fundamentals), but they are typically integrated stepwise. Starting with one doesn't mean you're limited - it just means you are prioritizing learning and utility. As your project or questions expand, you can pull in additional data categories from FMP to complement your analysis. In short, start narrow, then broaden strategically.
Does FMP provide data for crypto/forex/commodities/etc., and should that be my starting point?
Yes, FMP offers data for cryptocurrencies, forex, and commodities as part of its market data coverage. If your specific goal involves one of those markets (say you're building a crypto portfolio tracker or a currency conversion tool), then by all means start with the relevant category (Crypto Data APIs or Forex Market Data APIs). The structure is similar - you can get real-time and historical prices for Bitcoin, Ethereum, major forex pairs, commodity prices like gold, etc.
However, if these are not your main focus, they don't need to be in your starting dataset. For example, if you mostly care about U.S. equities, you can stick to stock data first; you can always tap into crypto or forex later if your scope grows. FMP's data spans multiple asset classes: start with the asset class or market that aligns with your project, and know that the others are available when you need them.

Top 5 Defense Stocks to Watch during a Geopolitical Tension
In times of rising geopolitical tension or outright conflict, defense stocks often outperform the broader market as gove...

Circle-Coinbase Partnership in Focus as USDC Drives Revenue Surge
As Circle Internet (NYSE:CRCL) gains attention following its recent public listing, investors are increasingly scrutiniz...

LVMH Moët Hennessy Louis Vuitton (OTC:LVMUY) Financial Performance Analysis
LVMH Moët Hennessy Louis Vuitton (OTC:LVMUY) is a global leader in luxury goods, offering high-quality products across f...

